Are you ready to win a title? (Part III)

In Part I we took a look at the differences and similarities of National Champions over the last 13 years. We discovered over this time there have been numerous schools, coaches, styles, tempos, and experience levels in the makeup of a National Champion. We also discovered using tempo free statistical data the majority of them have 2 things in common, strong offenses and even stronger defenses. In Part II we broke down the NCAAT by the round to determine if there is a clear statistical difference between teams who lose in each of the rounds. While it came as no shock to anyone to learn good (and even great) teams can blow it by losing early there is a distinction between most of the rounds. Using this information we can move on now to Part III where first we will briefly discuss the usage of this tool as a possible predictor for filling out your brackets (Ken Pomeroy even says his tempo free stats are a tool for predicting games) and secondly use it to evaluate coaches, starting with our own Mark Gottfried, to determine if they under or over achieve during the NCAAT and what kind of teams and expectations we should come to expect from him/them over the course of their tenure.

Prediction through Probability

Let’s start by plotting the ODS trends by round to get a visualization of what we have and overlay the 2015 version of the Wolfpack to see where it falls across each of the rounds. Note: Round 1 = Round of 64 and Round 7 = National Champion.

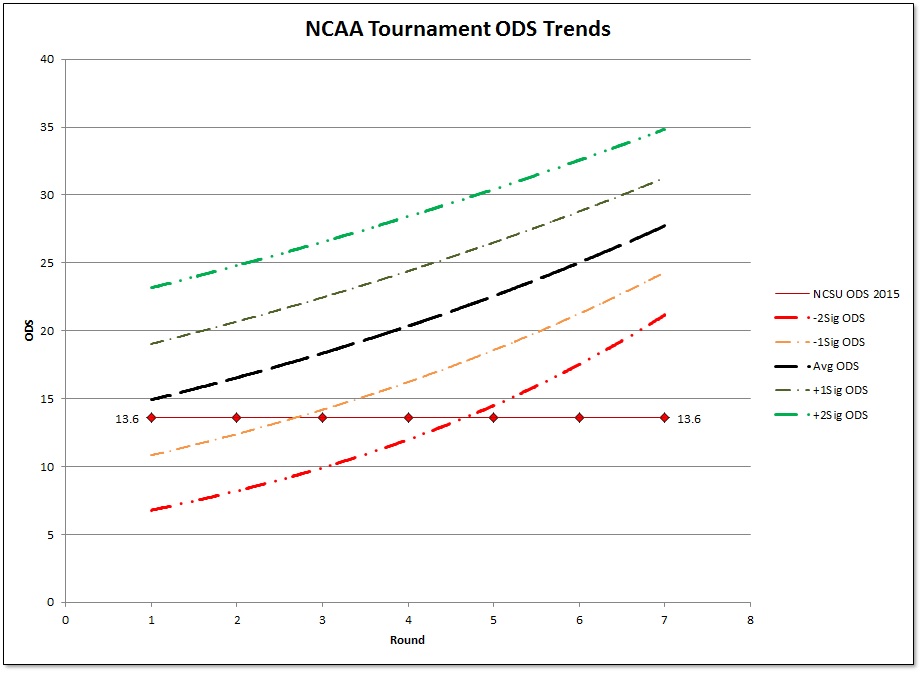
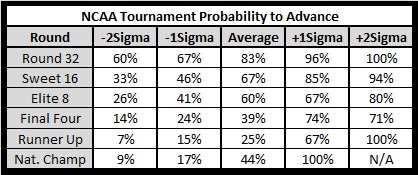
If you recall in Part II I laid out how the -1Sigma line delineates between the upper 84% and the bottom 16% of teams that lost in each round and thus who should have a legitimate chance at qualifying for the round. If we look at the current ODS value of the Wolfpack heading into the 2015 NCAAT we see they are near the bottom of the 84% who will make the Round of 32 and then less likely to make it to the second weekend. Here are the ODS, AOE, & ADE values of the sigmas for each round.

Breaking the ODS into the Adjusted Offensive Efficiency (AOE) and Adjusted Defensive Efficiency (ADE) we can plot the 2015 Wolfpack to see how we’ll they are expected in each phase. Looking at the AOE we see the Pack have at least a Final Four (FF) caliber offense but when you look at the Pack’s ADE we see what is truly holding them back to the first weekend. I’m attaching the table of MG’s teams showing the 3 values and breaking down the defense into the Four Factors and final results.

Next I calculated the probability of reaching each round by ODS values. If we plot the 2015 Wolfpack we can see they have about a 74% chance of reaching the Round of 32 and a 44% chance of reaching the Sweet 16. After that the percentages are so low it’s not even worth mentioning.

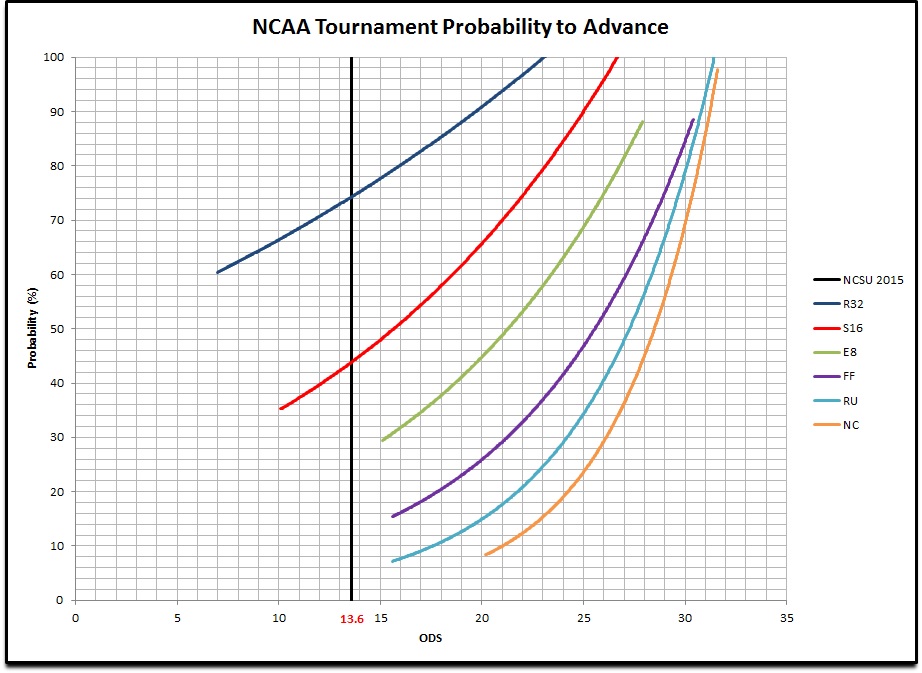
I believe this can be a useful tool in helping you decide just how far into the NCAAT you might want to place teams.

Mark Gottfried

Now let’s start looking at our own coach, Mark Gottfried (MG), and try and get an idea of how he’s done over the last 13 years. I will be using the final ODS values for these bell curve graphs to see how his teams ended the season in relation to the rest of the population. If we overlay MG teams with the Round of 32 (R32) we can see they are right in the 68% population (+/-1Sig) of teams who make the R32. This tells us that he produces clear R32 teams every year he’s been in the tournament.

Looking at MG in comparison to the Second Weekend teams we see about 50/50 playing into the bottom of the S16 while only a blip to the bottom of the E8. Lastly we see MG just hasn’t played up to the level of the Final Four or beyond.

Let’s look at this in a table format on a round by round basis to see how he has done in relation to how his teams have entered the NCAAT.

NOTE: These ODS values are Pre-NCAAT so we get an idea of predicting how he should have done and what he really did.

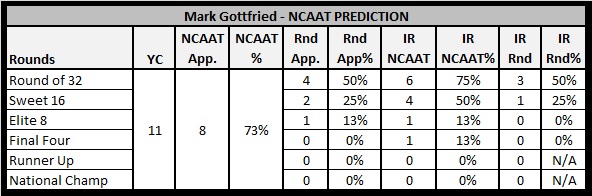
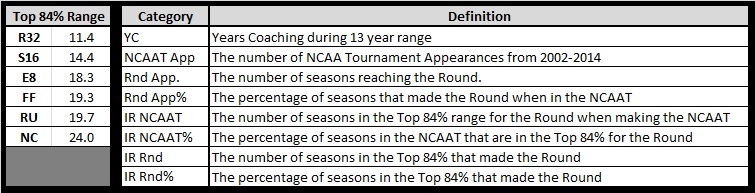
Let me try and explain what we’re looking at in case my legend is unclear:
MG has been coaching for 11 of the last 13 seasons; he has been to the NCAAT 8 of those 11 years for an appearance of 73%. Of those 8 NCAAT appearances he has had 4 teams reach the Round of 32 equaling 50%. When entering the NCAAT his teams had an ODS value of at least -1Sigma for the R32 a total of 6 times and of those 6 teams only 3 of them made it to the R32 for 50%.

As you can see most of his teams are first weekend teams and as such have performed that way. He has entered the NCAAT with 1 team capable of making the FF but did not reach it. So how much has he under or overachieved in the NCAAT?

If you have a team predicted to make Round X and you lose at least 2 rounds prior to the predicted round then you have underachieved. The exception being the Runner Up and losing in the E8, there is minimal separation between the 2 rounds. For example, you team is predicted to make the S16 and you lose in the R64 then you underachieved.

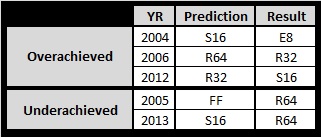
We can easily when times MG has under and overachieved and both have been at Alabama and NC State. While he hasn’t overachieved much, simply making it 1 round beyond prediction, he has bombed pretty badly twice.

How does Mark Gottfried compare to other coaches?

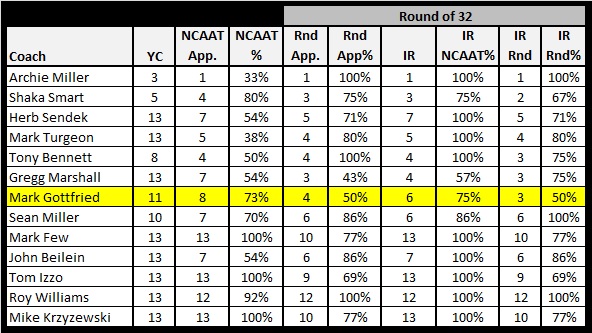
Looking at the Round of 32 we see while MG passable percentage of teams going in as R32 capable he falls short in getting those teams to the R32 as compared to a list of coaches who are early, similar, and long in their careers as coaches.

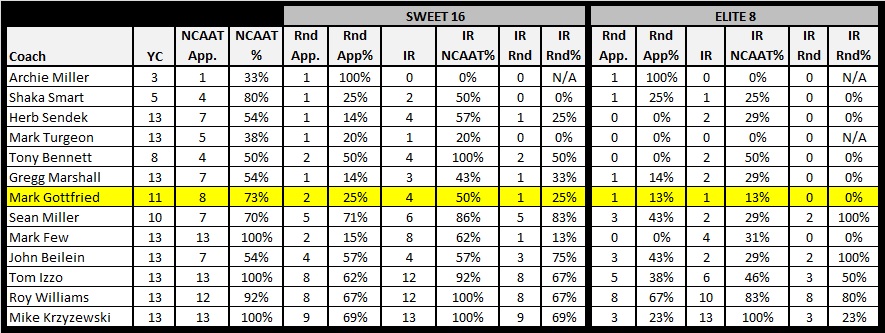
As you can see most coaches percentages are dropping as we go further into the rounds but the questions remain, how is he doing in comparison to others and again he is lagging behind. I do want to point out a couple of other coaches: Mark Few has shown over the years he is a good regular season coach but gets an F in the NCAAT; also Sean Miller consistently meets the expectations that is expected of him time and time again with the teams he has created when entering the tournament and does it at a second weekend level.

Before we look at the National Champions I want to point out a couple of things about the FF and RU: Can anyone believe that Sendek has created 2 Runner Up teams during his time? I was floored. Also just look at K’s numbers and has anyone done less with more than he has over the last 13 years?

Finally the National Champions.

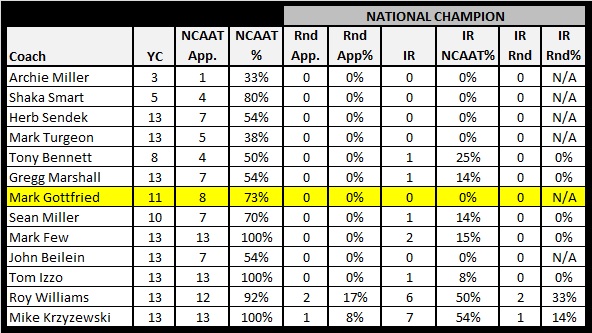
As we can see there are a handful of coaches who have created the teams capable but 2 on this list stand out as consistently doing it and that’s Roy and K. I wonder how long until the landscape will change.

SUMMARY

I’ve laid out a few tools that I hope can be helpful to others in filling out their brackets and helping to evaluate coaches, including Mark Gottfried. Gottfried has shown over the years to be a first weekend NCAAT coach. His teams come in with good offenses but usually lack in defense which is a big contributor to his teams entering the NCAAT as first weekend teams. I do believe the data backs up this assertion. If Gottfried wants to go further, If NC STATE wants to go further under MG, then he has to do a better job than he has shown because at this moment he’s not even setting up his teams to catch lightning in a bottle to make deep runs.

About 1.21 Jigawatts

Class of '98, Mechanical Engineer, State fan since arriving on campus and it's been a painful ride ever since. I live by the Law of NC State Fandom, "For every Elation there is an equal and opposite Frustration."

Big Four Rivals College Basketball Mark Gottfried NCS Basketball

Home Forums Are you ready to win a title? (Part III)

Viewing 25 posts - 1 through 25 (of 51 total)
  • Author
    Posts
  • #80257
    1.21 Jigawatts
    Keymaster

    In Part I we took a look at the differences and similarities of National Champions over the last 13 years. We discovered over this time there have bee
    [See the full post at: Are you ready to win a title? (Part III)]

    #80263
    Rick
    Keymaster

    Its hard to argue what you are not sure you understand.
    That is impressive stuff.

    #80265
    MP
    Participant

    Outstanding effort, outstanding work, outstanding post.

    #80268
    D Wolf
    Participant

    Very impressive analysis. The only reservation that I would have, especially as it relates to the Wolfpack, is that these calculations are based assuming normal distribution. With the Jekyll and Hyde nature of Pack’s performance historically, and especially this season, I’m not sure of the predictive value of an average. While I haven’t taken the time to run the numbers on Defensive Efficiency, just looking at average defensive scoring from before the 2nd UVA game to the average from the 2nd UVA game going forward, I believe you would see a significant bipolar distribution; the two lapses being the BC game and the Duke loss in the ACCT. I’m sure that each team has this to one degree or another. For the Pack the UVA game in Raleigh seemed to mark a very definitive mean shift in defensive performance that I would think you could measure in defensive efficiency. The controlling factor seems to be defensive intensity. The performance at BC and the Duke ACCT game proves that this is still a variable, but one that was controlled better in the last part of the season than the first. In the less favorable mode the Pack is capable of losing to anyone. In the more favorable, UVA-esque defensive mode the Pack is capable of beating anyone.

    Jigs, you are a far better statistician than I. Is it possible to weight these two modes and control them based on the likelihood of controlling the defensive intensity variable? I would think that, based on the fact that lately the coaches have done a better job controlling this than earlier on, this would give a higher weight to the more favorable mode and therefore yield a higher projected ceiling for this team.

    #80270
    1.21 Jigawatts
    Keymaster

    I believe I mentioned in Part II, if not the main article then in the comments section, that Ken Pomeroy’s adjusted efficiencies are based on a team playing at that moment against the average defense. He’s stated his numbers are not a mean average of the season but rather how is the team playing at that moment in order to provide a predictor of the next game vs. how they’ve done over the season. When he say’s our AOE = 112 and our ADE = 98 then that’s how we’re playing at the moment.

    There will always be exceptions to the rule, what I’ve laid out is a look removing the least likely chances of making each round. Nothing is preventing the Pack, or any team, from playing better and increasing their ODS and thus improving their chances to advance further into the tournament but the Pack are what their stats say they are, a weak first weekend team, and Gottfried doesn’t have a history of being a tournament coach making runs further than 1 round beyond their predictive value.

    #80273
    Tau837
    Participant

    Reading on my phone so didn’t really examine the charts and tables. But the biggest issue that leads me to doubt the validity of this method from your writeup is the reference to two runner up caliber teams from HWSNBN.

    It would be interesting to use this method to examine deep runs by “Cinderella” teams past like UConn (recent), Butler (recent), Nova ’85, Pack ’83, etc.

    #80274
    Wufpacker
    Participant

    #80275
    PackerInRussia
    Participant

    Its hard to argue what you are not sure you understand.

    Are you kidding? People do it all the time. It’s a touchstone of the Internet. I think that’s why it was invented. 🙂

    Great stuff, although, I have to admit to being too dumb to understand a lot of it.

    #80277
    1.21 Jigawatts
    Keymaster

    Reading on my phone so didn’t really examine the charts and tables. But the biggest issue that leads me to doubt the validity of this method from your writeup is the reference to two runner up caliber teams from HWSNBN.

    It would be interesting to use this method to examine deep runs by “Cinderella” teams past like UConn (recent), Butler (recent), Nova ’85, Pack ’83, etc.

    Maybe it’s not the validity in question but rather the coach??

    FYI the teams in question were…
    1. 2004 (23.8) R32 loss to Vanderbilt with Hodge, Evtimov, Atsur, Melvin, Sherrill, Watkins, Bennerman.
    2. 2009 (20.7) R32 loss to Syracuse with Harden and Pendergraph.

    Looks like a big waste of talent to me by a coach who can’t adjust in a game.

    As for Cinderella’s I already examined UConn and Butler in the previous parts. If KenPom posted data all the way back to 83 then trust me I’d have analyzed it already.

    #80280
    Tau837
    Participant

    Thanks, Jig. Very interesting stuff.

    #80284
    13OT
    Participant

    There is no way anyone with any degree of logic can make a good coach out of Herb Sendek, even on paper.

    How many times did Sendek teams fail to deliver when they should have? The 15-point lead against Duke in the ACCT finals with 9 minutes to go comes to mind, or the classic meltdown vs Vanderbilt. Then there’s the classic ASU meltdown vs USC in the Pac-10 title game a few years ago, when the Sun Devils were clearly the better team with James Hardin and Jeff Pendergraph, but blew it in the end. There just seemed to be something about seeing Herb on your bench that made good players go to pieces in the final minutes of a game that meant something.

    I can’t stand UConn, but if they win big tomorrow night, I may flash a “told you so” grin when the Huskies blow out ASU.

    #80285
    wufpup76
    Keymaster

    Great series. Thank you.

    It’s hard to think of K and ‘underperforming’ at the same time, but I suppose that’s what the losses to Lehigh and Mercer speak to. That said, while I love the predictive nature of the formula I can’t get behind assigning labels such as ‘underachieve’ and ‘underperform’ while using it.

    Losses like Lehigh and Mercer can, will, and do happen. It’s the definition of 1-game tournament basketball. I feel the formula could be incredibly useful for identifying patterns of “falling short” which could support a “you’re an underperformer” type of conclusion.

    Using K as an example (and I know there was no assertion K was an underperformer), he has won a National Title in the same time span listed while also falling well short with some teams … So I think the formula is a very useful metric for both predictive values and pattern identification, but it’s not a catch all 🙂

    I’d also say that using the formula adds more weight to the ‘I trust what my eyes tell me’ element of judging teams. While Herb obviously created a couple of ‘high potential’ teams I find it hard to believe anyone picking a Herb-coached team to reach a Final Four haha. Also, some of K’s over the years have screamed “we will be upset early”.

    Wildly interesting stuff. Thanks for your work!

    #80286
    Primewolf
    Participant

    Impressive. Your model does well in terms of predicting performance based on 1 metric.

    Do you think coaches can get smarter, hire assistants that can make a difference, and recruit better once they have been at a school for 4-5 years. Or are they stuck in their own mud, so to speak. Would be interesting to see the time trends of coaches over 20 years.

    great work. How do you use statistics as an ME?

    #80287
    VaWolf82
    Keymaster

    It would be interesting to use this method to examine deep runs by “Cinderella” teams past like…Pack ’83, etc.

    State went 6-4 against teams that were ranked #1 sometime during the 82-83 season. Sorry, but that doesn’t sound like a Cinderella to me.

    #80288
    Wulfpack
    Participant

    Great stuff. Thank you.

    Or are they stuck in their own mud, so to speak.

    On the whole, you should know what you have after 5 years. I wouldn’t expect any major variation in performance, especially when you have a coach on his second go around at a major program. There is a lot of data. It’s no so much “stuck in the mud” as it is just who they are. He’s close, but there’s still a steep hill to climb.

    #80289
    VaWolf82
    Keymaster

    I liked this series very much. It’s always nice when you have numbers to back up your gut feelings.

    It’s also nice when detailed, specific numbers lead to the same conclusion as more general ones like this:

    You’re not likely to make a deep run if you aren’t good enough to generate a good RPI.

    #80290
    MP
    Participant

    ^ you love your RPI… 🙂

    But good numbers.

    #80291
    VaWolf82
    Keymaster

    I started to type something sarcastic, but your comment got me thinking. I’ve actually mixed two versions of the RPI calc in the same table. I wonder what the table would look like if I only used the “old” calc which values home/road wins/losses the same.

    The net effect of the new RPI is to lower teams in the middle of power conferences and inflate the rankings of teams at the top of mid-majors. For instance, State’s RPI Ranking is 39 (CBS) but would be 30 (Dance Card) under the older formula.

    Oh well, it’s a long time between March Madness and the first football game on Labor Day weekend. I’ll have to find some time this summer to see if there is anything worth looking at.

    #80292
    choppack1
    Participant

    Vawolf – what I would really like to see is some comparative research. What’s better at predicting the better team….heck, you might be able to look at the final ap poll too and see how close it is.

    Long story short. If we can learn to play d under gott like we can play o – we can contend for a final 4 (on a somewhat regular basis.) However, if not – vive LA bubble!

    #80301
    wufpup76
    Keymaster

    Might be fun to compare and contrast Jig’s ODS against something like 538’s complex model:

    FiveThirtyEight interactive predictions

    #80302
    VaWolf82
    Keymaster

    What’s better at predicting the better team….heck, you might be able to look at the final ap poll too and see how close it is.

    Everyone in Vegas would like better predictors too.

    For me, the key point of 1.2JW’s work is that it provides solid basis for what a lot of people have said about Gott’s teams….the offense is good and the defense/rebounding definitely isn’t. While it takes no particular insight to reach those conclusions, the numbers presented in these three entries show just how far off the mark Gott’s teams have been.

    As far as AP vs RPI….I did that in the days of the Great Herb Debate:
    AP Top 10 > RPI Top 10
    RPI 11-25 > AP 11-25

    My rationale went like this:
    RPI will not tell you who is hottest (or coldest) at tournament time because it is averaging the entire season. But if you lose a few games, you will drop out of the AP Top 10 pretty quick. But the RPI does better at 11-25 because big-name teams can hang around in the AP Top 25 seemingly forever.

    #80306
    BJD95
    Keymaster

    I think we will have a pretty good idea about MG after Years 5 and 6, for sure.

    #80307
    VaWolf82
    Keymaster

    I think we already have a pretty good idea about Gott. Here’s to hoping that Years 5 and 6 will change my view.

    #80308
    1.21 Jigawatts
    Keymaster

    For me, the key point of 1.2JW’s work is that it provides solid basis for what a lot of people have said about Gott’s teams….the offense is good and the defense/rebounding definitely isn’t. While it takes no particular insight to reach those conclusions, the numbers presented in these three entries show just how far off the mark Gott’s teams have been.

    Thanks VaWolf, that’s exactly how it started. I questioned Gottfried’s teams and I had my hypothesis where they are good on offense but the defense is what’s holding us back. At that point I went out to try and prove it wrong by starting at the beginning of What do all the champions have in common? (Part I). When I could clearly see it was the defense that separated Gottfried from the upper echelon then I moved on to, If Gottfried isn’t near a national championship then where is he? So I moved on to the second part of finding out where everyone else in the NCAAT ended up losing. (Part II) Now I could compare MG to the field over the last 13 seasons and get an accurate assessment of what kind of coach he had been during that time frame. (Part III)

    I understand this can be some high level stuff and believe me it’s difficult to explain to those who haven’t learned about statistical tools but what needs to be taken away is Don’t discount the numbers. People may not want to believe the numbers but that doesn’t make them inaccurate. I’m not saying I’ve developed some magic formula for success, quite the opposite, I’m simply laying out an emotion free case for what to expect from Gottfried as well as the realistic likelihood of advancement into the NCAAT for any team, especially NC State. Too many people fall back on ’83 as a reason to hold out all hope and I’m all for hope but let’s be realistic about what we have. There are no guarantee’s but I laid it out in graph/table form that the better you do offensively and defensively the better chances you have to advance and if you are really low then those chances are almost non-existent.

    This isn’t a sexy series for an article, I could have simply thrown up there that Gottfried sucks at defense and so and so coach is better and let the lowest common denominator win out. Instead I wanted to back up what many people already felt with cold, hard facts. If State wants to move on to the second weekend consistently, making runs to the Final Four and beyond, then Gottfried is going to have to change, IMPROVE, and it has to start with defense.

    #80309
    1.21 Jigawatts
    Keymaster

    I think we already have a pretty good idea about Gott. Here’s to hoping that Years 5 and 6 will change my view.

    THIS!!!!

Viewing 25 posts - 1 through 25 (of 51 total)
  • You must be logged in to reply to this topic.