
In Part I we discussed what it takes to be a National Champion and what they all have in common. If you missed the article then I highly suggest going back and reading it before proceeding with Part II. The next question that came to mind after figuring out the make-up of a National Champion was, “If I don’t have an ODS of 25 then where should I be finishing?” In Part II we will look at ODS in relation to what round the team lost in to get an idea of where you should expect to finish with a value of X ODS. This will help to gage a program on if they are close to winning a title (or advancing further into the NCAAT) as well as distinguishing if there is much difference between the teams that end in each round. For example, are teams that finish in the Sweet 16 that much different than teams that finish in the Elite 8?
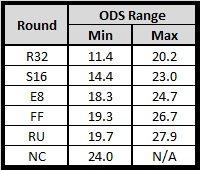
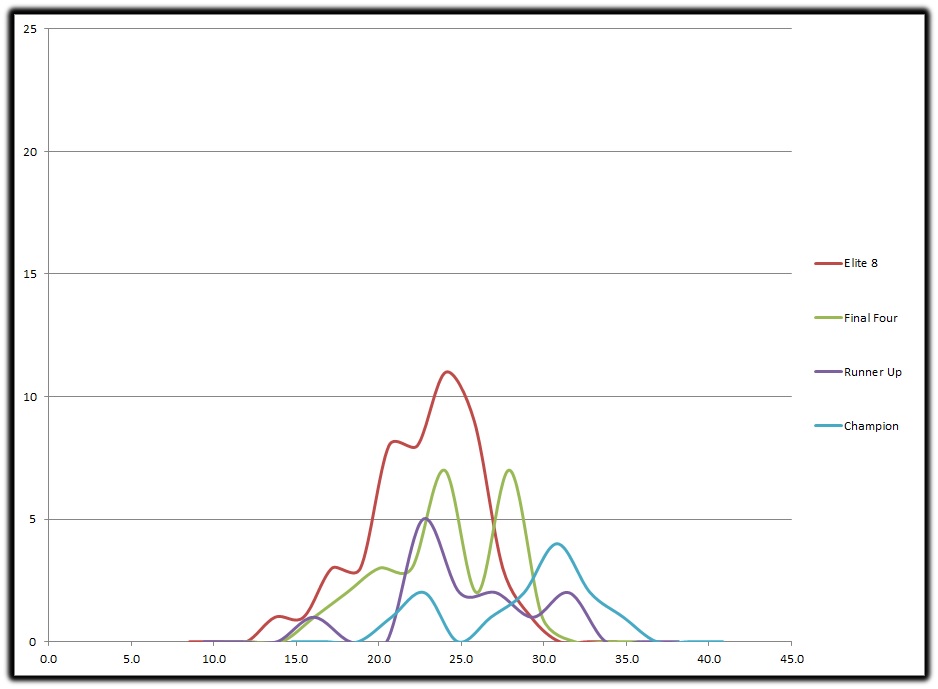
Once again I’ll be using final numbers from each season from Kenpom.com to develop ODS values and then graphing them using a population bell curve. The teams used in each round are the losers of that round, with the lone exception being the champions. This means the Sweet Sixteen (S16) teams are the teams who made it to the S16 but lost their game, simple enough. First up are the bell curves for the rounds of Round of 32 (R32), S16, Elite Eight (E8), Final Four (FF), Runner Up (RU), and National Champions (NC).
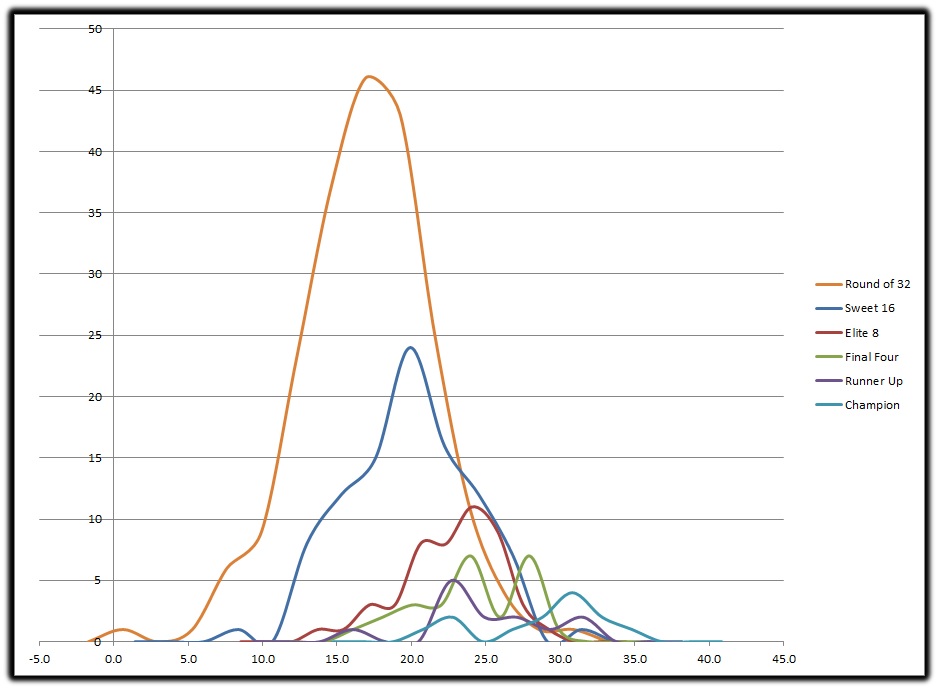
BELLCURVE OF ALL ROUNDS
Well, that looks like a big mess. Lots of overlap of teams with similar values of ODS. So what do we make of it? First off this tells us that even the really good teams can lose early, thus having a really strong ODS is no guarantee. What it also tells us is the higher your ODS value the greater the chances are of making it further into the NCAAT, which hopefully by now comes as no surprise to anyone.
Using 6 Sigma as a tool we will determine the defects (teams that underperformed and over performed) in the round to help us set up a limit for analysis between rounds. This tool is normally used in production with sample sizes in the thousands to millions but we can still make it work here, it just won’t be as accurate the smaller the sample size becomes. We can use it to determine with the standard deviation if there is a statistical difference between the teams that lose in each round.
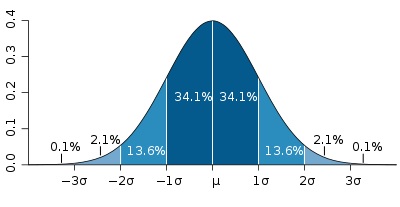
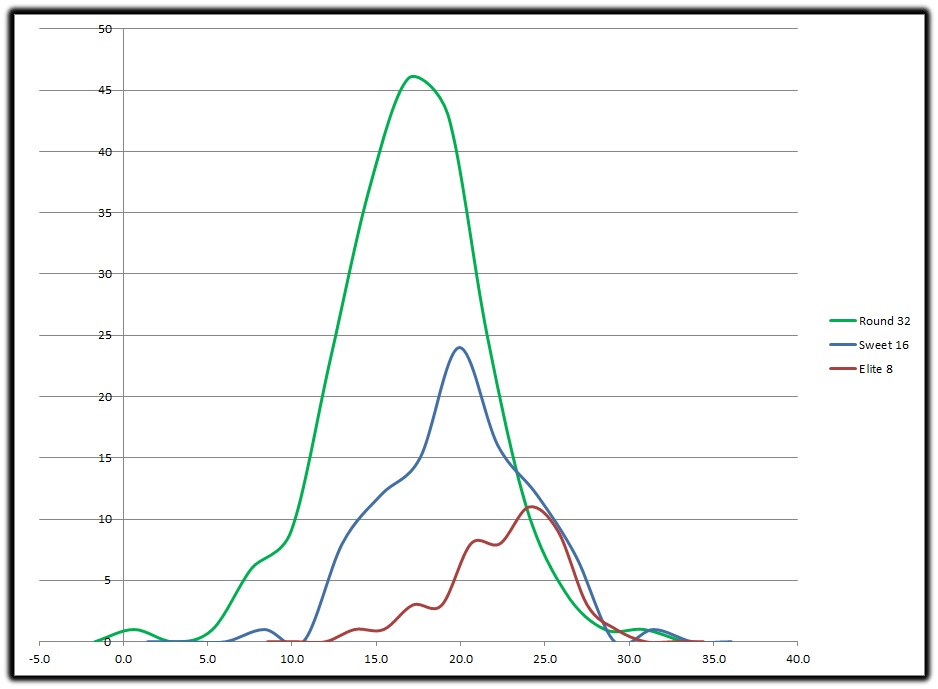
For those not familiar with 6 Sigma and standard deviations don’t worry, here’s it in a nutshell. It’s determining the variation within a set of data, for us it’s determining the variation between the teams ODS in each round. If the values of a population are close together you’re get a sharp spike, meaning there’s not much difference between the teams. If the values are spread out you’ll have a wide, short hill, meaning there’s a big difference in the teams. If you take +/-1 Sigma from the Average you will have 68% of the population. If you take +/-2 Sigma you now have 95% of the population. If you take +/-3 Sigma you have 99.7% of the population. Let’s look at the teams that made it to the Sweet 16 but lost that game since it has a nice bell curve.
3SIGMA BELLCURVE GRAPH
As you can see the middle of the bell curve has the greatest population where the middle is the mean (average) and then you go 1 sigma (standard deviation) to achieve 68% of the population. If you continue out another sigma then you will have 95% of the population.
SWEET 16
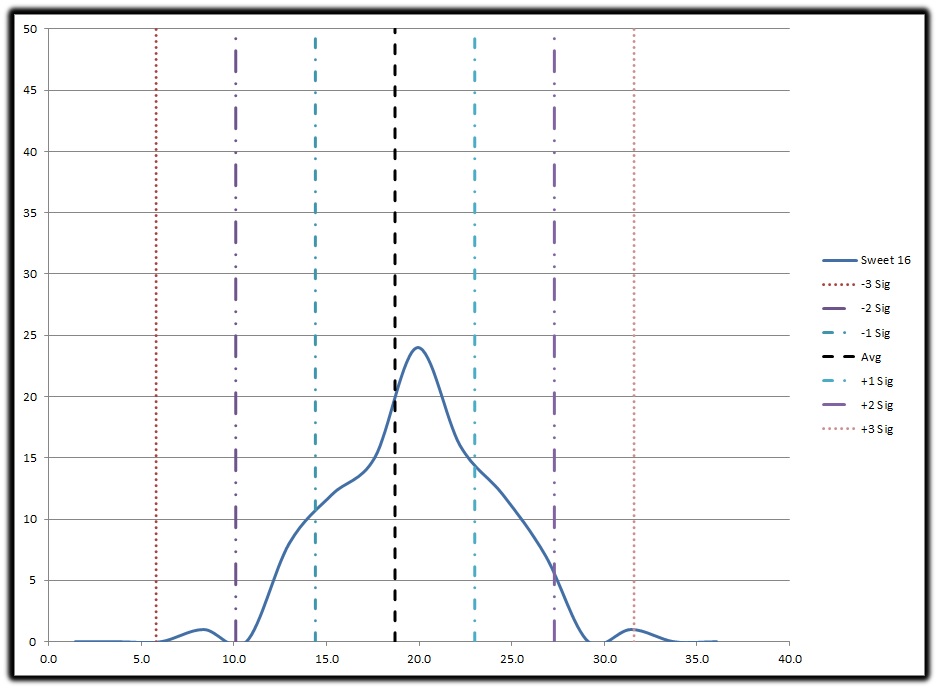
S16 6SIG GRAPH
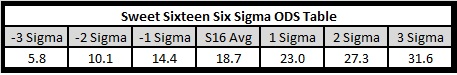
If you set the lower limit at -2 Sigma (ODS=10.1) and the upper limit at +2 Sigma (27.3) you can see who clearly over achieved and under achieved, totaling 5% of the teams which is only three teams and much too small. If you take the population from -1Sigma (ODS = 14.4) to +1Sigma (23.0) we have 68% of the teams that reached the Sweet 16 but lost. That’s a good percentage of the population and helps us better determine who overachieved in reaching the S16 and who underachieved by failing to move further into the tournament. Setting the upper and lower limits of each round at +/1 sigma will produce the range we desire to determine if a team “should” make that round. Here are the results:
Can we truly be this accurate though in predicting if you’ll make it? I say maybe and here’s why: Overlap. What do I mean? Let’s take a look at just the teams who reached but lost in the R32, S16, and E8.
Each graph (population) effectively fits within the others thus stating the teams on the upper end of the E8 can just as easily end their season in the R32 or S16. The difference is the bottom end of each round, the population range shrinks and thus you have less variation in the round as you progress. So while you have no guarantee of reaching the E8 if you have an ODS value of say 25.0 what can see is if you are below 14.0 you stand almost zero chance. The question becomes is there a statistical difference between these 3 rounds?
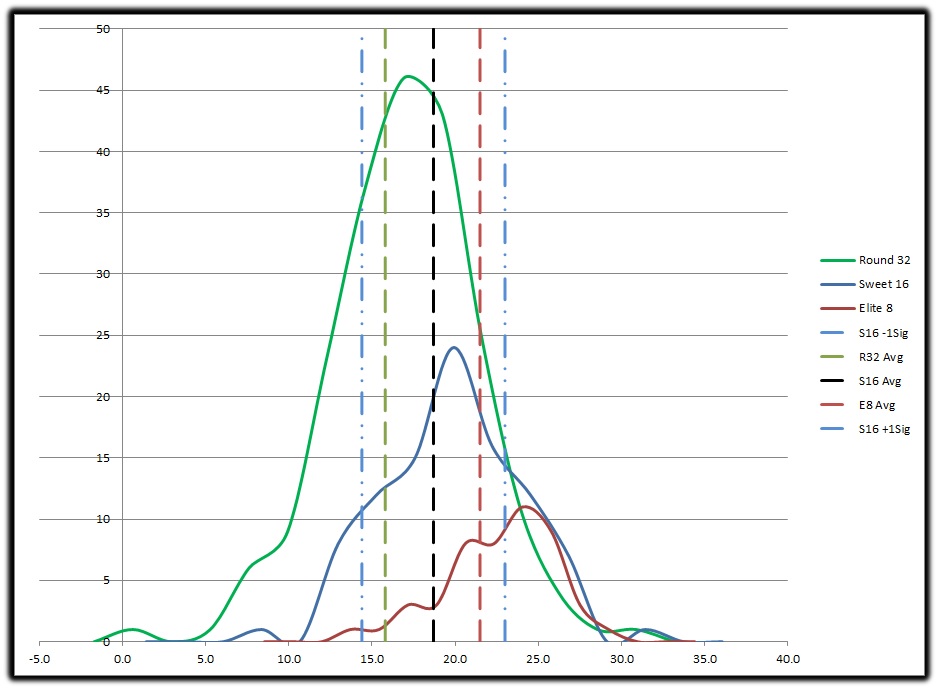
If you look closely you can see the R32 Avg and E8 Avg lines have shifted almost a full standard deviation from the S16 Avg. This tells us yes there is a statistical difference between the majority of the population who loses in the R32 and the majority of the population that loses in the E8.
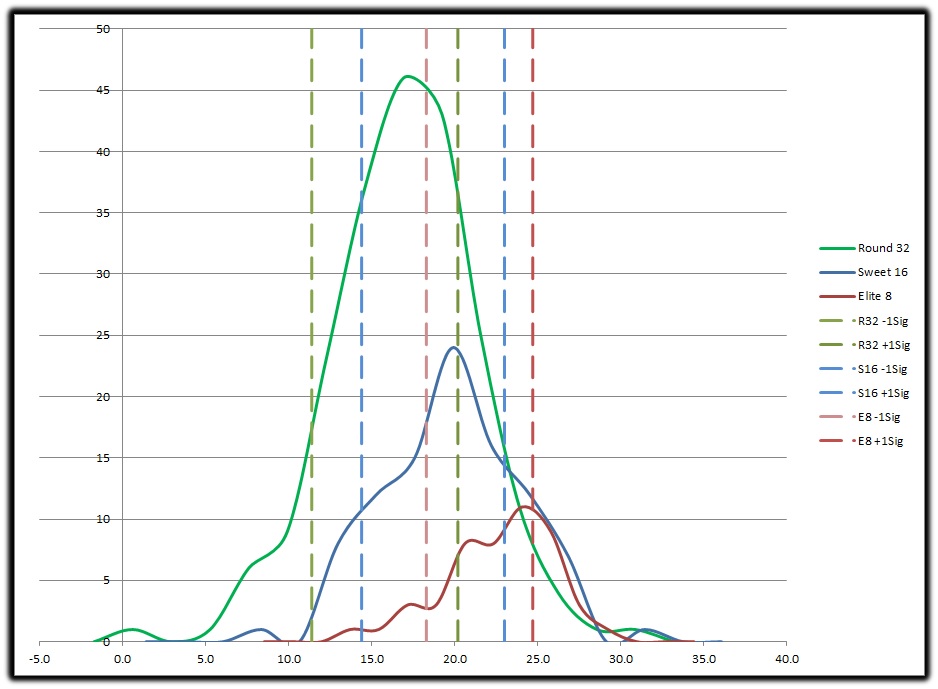
Here we are looking at the 68% population for the 3 rounds (R32, S16, E8) and see there is major overlap with the S16 in relation to the other 2 rounds. If I were to plot the E8 Avg (21.5) we’d see it is more than one standard deviation of R32 Avg. This tells us there is a clear and distinct statistical difference between R32 and E8. The majority of the population (68%) who lost in the S16 overlaps with both the R32/E8 with half being roughly in each. This tells us it may be more accurate to say you are a “First Weekend Team” or a “Second Weekend Team” putting the cutoff between weekends at the S16 Avg (18.7) than it is to say you will reach X round. For now we will still use the +/- 1 Sigma range to determine if you over or under achieved, showing the sigma lines helps us determine if you should take a chance on booking plan tickets and hotel rooms for the next weekend. Thus having an ODS value of at least 18.3 (-1 Sigma E8) should be a “safe” bet on booking those second weekend plans. Also, with roughly a full standard deviation shift between the means in each of those 3 rounds it’s clear there is a statistical difference in the population of each of those rounds and you can say yes, a higher ODS “should” get you further into the tournament.
What about the Final Four Weekend?
Now we’ll look at the third weekend, Final Four, and determine if there are clear differences between those teams within that weekend and from the second weekend.
That’s some overlap. The question is, is there a statistical difference between the rounds?
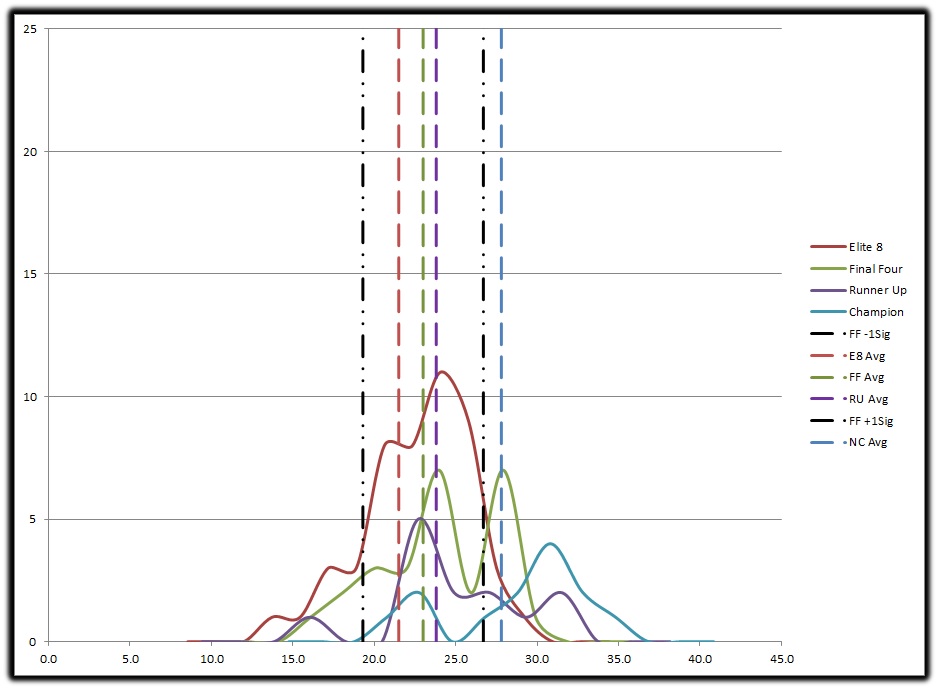
Again, another busy graph but let’s walk through it and it’ll become clearer. Looking at the Elite 8 Average (Red), E8 +/-1Sig (Black), Final Four Avg (Green), and Runner Up Avg (Purple) we can see there’s not much difference between the 3. The averages for E8 and RU are close to the FF Avg, while there is a statistical difference that difference is small, very small between FF & RU. This tells us not much separates the teams between the E8 and reaching Final Four and even less separates a team losing in the Final Four and one losing in the Championship Game. What we can also see is just how much better the National Champion is than the others who reach those other 3 rounds. In fact the average National Champion is in the top 2.5% of the population who lost in the Elite 8, that’s what I call a pretty clear and distinct difference between them. While not much separates a team who loses in the Elite 8 and those that lose in the next weekend, there’s still a big difference between a second weekend team and a National Champion.
What Are The Key Differences Between Rounds?
Well it changes, some rounds (on average) it’s the offenses that are different and some it’s the defense that separates them. Here is a chart of the averages of each round looking at the Offense, Defense, and Spread.
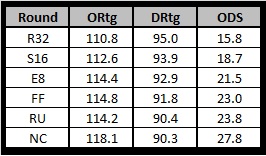
Looking at the table we see a few things:
1. The average difference between teams in the E8, FF, & RU is simply their defense.
2. The difference between the National Champion and the Runner Up is usually offense.
3. Better Offenses AND Defenses will help you go further into the tournament. DUH!!!
SUMMARY
So what can we take away from all of this? First we can see no one is immune from underachieving in the tournament but the higher your ODS the better your chances are for going further into the tournament. Second, the Elite 8 is clearly a step above the first weekend, very close to the Final Four but still has a long ways to go before winning a National Title. The Sweet 16 could easily be categorized as teams that overachieved from the first weekend or underachieved from making it to the Elite 8. It’s less about positioning yourself to reach the Sweet 16 and more about did you overachieve to reach it or did you underachieve in failing to reach the Elite 8 or higher. There are always exceptions to the rules for each round but over time the numbers prove it out.
I hope this helps to show what the differences are between the teams who reach each round and how close or far away a team is on average to making it to the next level and eventually a championship.
