Home › Forums › All StateFansNation › Are you ready to win a title? (Part III)
- This topic has 50 replies, 17 voices, and was last updated 11 years, 2 months ago by
Heelh8r.
-
AuthorPosts
-
03/17/2015 at 12:09 PM #80257
1.21 Jigawatts
KeymasterIn Part I we took a look at the differences and similarities of National Champions over the last 13 years. We discovered over this time there have bee
[See the full post at: Are you ready to win a title? (Part III)]03/17/2015 at 12:41 PM #80263Rick
KeymasterIts hard to argue what you are not sure you understand.
That is impressive stuff.03/17/2015 at 1:07 PM #80265MP
ParticipantOutstanding effort, outstanding work, outstanding post.
03/17/2015 at 2:14 PM #80268D Wolf
ParticipantVery impressive analysis. The only reservation that I would have, especially as it relates to the Wolfpack, is that these calculations are based assuming normal distribution. With the Jekyll and Hyde nature of Pack’s performance historically, and especially this season, I’m not sure of the predictive value of an average. While I haven’t taken the time to run the numbers on Defensive Efficiency, just looking at average defensive scoring from before the 2nd UVA game to the average from the 2nd UVA game going forward, I believe you would see a significant bipolar distribution; the two lapses being the BC game and the Duke loss in the ACCT. I’m sure that each team has this to one degree or another. For the Pack the UVA game in Raleigh seemed to mark a very definitive mean shift in defensive performance that I would think you could measure in defensive efficiency. The controlling factor seems to be defensive intensity. The performance at BC and the Duke ACCT game proves that this is still a variable, but one that was controlled better in the last part of the season than the first. In the less favorable mode the Pack is capable of losing to anyone. In the more favorable, UVA-esque defensive mode the Pack is capable of beating anyone.
Jigs, you are a far better statistician than I. Is it possible to weight these two modes and control them based on the likelihood of controlling the defensive intensity variable? I would think that, based on the fact that lately the coaches have done a better job controlling this than earlier on, this would give a higher weight to the more favorable mode and therefore yield a higher projected ceiling for this team.
03/17/2015 at 2:38 PM #80270KeymasterI believe I mentioned in Part II, if not the main article then in the comments section, that Ken Pomeroy’s adjusted efficiencies are based on a team playing at that moment against the average defense. He’s stated his numbers are not a mean average of the season but rather how is the team playing at that moment in order to provide a predictor of the next game vs. how they’ve done over the season. When he say’s our AOE = 112 and our ADE = 98 then that’s how we’re playing at the moment.
There will always be exceptions to the rule, what I’ve laid out is a look removing the least likely chances of making each round. Nothing is preventing the Pack, or any team, from playing better and increasing their ODS and thus improving their chances to advance further into the tournament but the Pack are what their stats say they are, a weak first weekend team, and Gottfried doesn’t have a history of being a tournament coach making runs further than 1 round beyond their predictive value.
03/17/2015 at 4:18 PM #80273Tau837
ParticipantReading on my phone so didn’t really examine the charts and tables. But the biggest issue that leads me to doubt the validity of this method from your writeup is the reference to two runner up caliber teams from HWSNBN.
It would be interesting to use this method to examine deep runs by “Cinderella” teams past like UConn (recent), Butler (recent), Nova ’85, Pack ’83, etc.
03/17/2015 at 4:21 PM #80274Wufpacker
Participant 03/17/2015 at 4:22 PM #80275
PackerInRussia
ParticipantIts hard to argue what you are not sure you understand.
Are you kidding? People do it all the time. It’s a touchstone of the Internet. I think that’s why it was invented. 🙂
Great stuff, although, I have to admit to being too dumb to understand a lot of it.
03/17/2015 at 5:04 PM #80277KeymasterReading on my phone so didn’t really examine the charts and tables. But the biggest issue that leads me to doubt the validity of this method from your writeup is the reference to two runner up caliber teams from HWSNBN.
It would be interesting to use this method to examine deep runs by “Cinderella” teams past like UConn (recent), Butler (recent), Nova ’85, Pack ’83, etc.
Maybe it’s not the validity in question but rather the coach??
FYI the teams in question were…
1. 2004 (23.8) R32 loss to Vanderbilt with Hodge, Evtimov, Atsur, Melvin, Sherrill, Watkins, Bennerman.
2. 2009 (20.7) R32 loss to Syracuse with Harden and Pendergraph.Looks like a big waste of talent to me by a coach who can’t adjust in a game.
As for Cinderella’s I already examined UConn and Butler in the previous parts. If KenPom posted data all the way back to 83 then trust me I’d have analyzed it already.
03/17/2015 at 5:52 PM #80280ParticipantThanks, Jig. Very interesting stuff.
03/17/2015 at 7:46 PM #8028413OT
ParticipantThere is no way anyone with any degree of logic can make a good coach out of Herb Sendek, even on paper.
How many times did Sendek teams fail to deliver when they should have? The 15-point lead against Duke in the ACCT finals with 9 minutes to go comes to mind, or the classic meltdown vs Vanderbilt. Then there’s the classic ASU meltdown vs USC in the Pac-10 title game a few years ago, when the Sun Devils were clearly the better team with James Hardin and Jeff Pendergraph, but blew it in the end. There just seemed to be something about seeing Herb on your bench that made good players go to pieces in the final minutes of a game that meant something.
I can’t stand UConn, but if they win big tomorrow night, I may flash a “told you so” grin when the Huskies blow out ASU.
03/17/2015 at 8:05 PM #80285wufpup76
KeymasterGreat series. Thank you.
It’s hard to think of K and ‘underperforming’ at the same time, but I suppose that’s what the losses to Lehigh and Mercer speak to. That said, while I love the predictive nature of the formula I can’t get behind assigning labels such as ‘underachieve’ and ‘underperform’ while using it.
Losses like Lehigh and Mercer can, will, and do happen. It’s the definition of 1-game tournament basketball. I feel the formula could be incredibly useful for identifying patterns of “falling short” which could support a “you’re an underperformer” type of conclusion.
Using K as an example (and I know there was no assertion K was an underperformer), he has won a National Title in the same time span listed while also falling well short with some teams … So I think the formula is a very useful metric for both predictive values and pattern identification, but it’s not a catch all 🙂
I’d also say that using the formula adds more weight to the ‘I trust what my eyes tell me’ element of judging teams. While Herb obviously created a couple of ‘high potential’ teams I find it hard to believe anyone picking a Herb-coached team to reach a Final Four haha. Also, some of K’s over the years have screamed “we will be upset early”.
Wildly interesting stuff. Thanks for your work!
03/17/2015 at 8:32 PM #80286Primewolf
ParticipantImpressive. Your model does well in terms of predicting performance based on 1 metric.
Do you think coaches can get smarter, hire assistants that can make a difference, and recruit better once they have been at a school for 4-5 years. Or are they stuck in their own mud, so to speak. Would be interesting to see the time trends of coaches over 20 years.
great work. How do you use statistics as an ME?
03/17/2015 at 8:59 PM #80287VaWolf82
KeymasterIt would be interesting to use this method to examine deep runs by “Cinderella” teams past like…Pack ’83, etc.
State went 6-4 against teams that were ranked #1 sometime during the 82-83 season. Sorry, but that doesn’t sound like a Cinderella to me.
03/17/2015 at 9:02 PM #80288Wulfpack
ParticipantGreat stuff. Thank you.
Or are they stuck in their own mud, so to speak.
On the whole, you should know what you have after 5 years. I wouldn’t expect any major variation in performance, especially when you have a coach on his second go around at a major program. There is a lot of data. It’s no so much “stuck in the mud” as it is just who they are. He’s close, but there’s still a steep hill to climb.
03/17/2015 at 9:11 PM #80289KeymasterI liked this series very much. It’s always nice when you have numbers to back up your gut feelings.
It’s also nice when detailed, specific numbers lead to the same conclusion as more general ones like this:
You’re not likely to make a deep run if you aren’t good enough to generate a good RPI.
03/17/2015 at 10:09 PM #80290Participant^ you love your RPI… 🙂
But good numbers.
03/17/2015 at 10:32 PM #80291KeymasterI started to type something sarcastic, but your comment got me thinking. I’ve actually mixed two versions of the RPI calc in the same table. I wonder what the table would look like if I only used the “old” calc which values home/road wins/losses the same.
The net effect of the new RPI is to lower teams in the middle of power conferences and inflate the rankings of teams at the top of mid-majors. For instance, State’s RPI Ranking is 39 (CBS) but would be 30 (Dance Card) under the older formula.
Oh well, it’s a long time between March Madness and the first football game on Labor Day weekend. I’ll have to find some time this summer to see if there is anything worth looking at.
03/17/2015 at 11:30 PM #80292choppack1
ParticipantVawolf – what I would really like to see is some comparative research. What’s better at predicting the better team….heck, you might be able to look at the final ap poll too and see how close it is.
Long story short. If we can learn to play d under gott like we can play o – we can contend for a final 4 (on a somewhat regular basis.) However, if not – vive LA bubble!
03/18/2015 at 9:17 AM #80301KeymasterMight be fun to compare and contrast Jig’s ODS against something like 538’s complex model:
03/18/2015 at 10:20 AM #80302KeymasterWhat’s better at predicting the better team….heck, you might be able to look at the final ap poll too and see how close it is.
Everyone in Vegas would like better predictors too.
For me, the key point of 1.2JW’s work is that it provides solid basis for what a lot of people have said about Gott’s teams….the offense is good and the defense/rebounding definitely isn’t. While it takes no particular insight to reach those conclusions, the numbers presented in these three entries show just how far off the mark Gott’s teams have been.
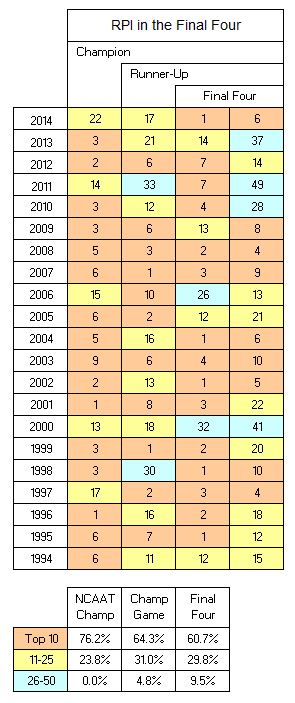
As far as AP vs RPI….I did that in the days of the Great Herb Debate:
AP Top 10 > RPI Top 10
RPI 11-25 > AP 11-25My rationale went like this:
RPI will not tell you who is hottest (or coldest) at tournament time because it is averaging the entire season. But if you lose a few games, you will drop out of the AP Top 10 pretty quick. But the RPI does better at 11-25 because big-name teams can hang around in the AP Top 25 seemingly forever.03/18/2015 at 10:53 AM #80306BJD95
KeymasterI think we will have a pretty good idea about MG after Years 5 and 6, for sure.
03/18/2015 at 11:04 AM #80307KeymasterI think we already have a pretty good idea about Gott. Here’s to hoping that Years 5 and 6 will change my view.
03/18/2015 at 11:08 AM #80308KeymasterFor me, the key point of 1.2JW’s work is that it provides solid basis for what a lot of people have said about Gott’s teams….the offense is good and the defense/rebounding definitely isn’t. While it takes no particular insight to reach those conclusions, the numbers presented in these three entries show just how far off the mark Gott’s teams have been.
Thanks VaWolf, that’s exactly how it started. I questioned Gottfried’s teams and I had my hypothesis where they are good on offense but the defense is what’s holding us back. At that point I went out to try and prove it wrong by starting at the beginning of What do all the champions have in common? (Part I). When I could clearly see it was the defense that separated Gottfried from the upper echelon then I moved on to, If Gottfried isn’t near a national championship then where is he? So I moved on to the second part of finding out where everyone else in the NCAAT ended up losing. (Part II) Now I could compare MG to the field over the last 13 seasons and get an accurate assessment of what kind of coach he had been during that time frame. (Part III)
I understand this can be some high level stuff and believe me it’s difficult to explain to those who haven’t learned about statistical tools but what needs to be taken away is Don’t discount the numbers. People may not want to believe the numbers but that doesn’t make them inaccurate. I’m not saying I’ve developed some magic formula for success, quite the opposite, I’m simply laying out an emotion free case for what to expect from Gottfried as well as the realistic likelihood of advancement into the NCAAT for any team, especially NC State. Too many people fall back on ’83 as a reason to hold out all hope and I’m all for hope but let’s be realistic about what we have. There are no guarantee’s but I laid it out in graph/table form that the better you do offensively and defensively the better chances you have to advance and if you are really low then those chances are almost non-existent.
This isn’t a sexy series for an article, I could have simply thrown up there that Gottfried sucks at defense and so and so coach is better and let the lowest common denominator win out. Instead I wanted to back up what many people already felt with cold, hard facts. If State wants to move on to the second weekend consistently, making runs to the Final Four and beyond, then Gottfried is going to have to change, IMPROVE, and it has to start with defense.
03/18/2015 at 11:11 AM #80309KeymasterI think we already have a pretty good idea about Gott. Here’s to hoping that Years 5 and 6 will change my view.
THIS!!!!
-
AuthorPosts
- You must be logged in to reply to this topic.
