If you’re new around here, this will be the third year that we’ve examined the ACC regular season schedules to see who got the easier/harder regular-season schedules. In the aftermath of ACC expansion and unbalanced schedules, it’s always been obvious that the schedules will vary in difficulty and I was curious to see how much difference existed. So exactly how do we rate the strength of schedules?
Let’s start with what we don’t do (anymore). We don’t simply compile the won/loss records of each team and declare which teams had the hardest or easiest schedules. To be completely honest, I did compile the records the first year that I looked at this. However, since this technique has an obvious deficiency, we broke down the schedules further to take a closer look at the relative difficulty of the schedules.
The main deficiency with a simple compilation is that the teams at the bottom can’t play themselves (thus inflating their opponent’s records) and they lose a lot which further inflates their opponent’s records. Conversely, the teams at the top don’t play themselves which limits how many wins their opponents can compile. However, a technique to address this deficiency is already available in the RPI calculation.
We haven’t discussed the RPI much this year, but the RPI calculation consists of three parts:
– a team’s winning percentage
– their opponents winning percentage
– their opponents’ opponents’ winning percentage.
The RPI calculation removes the results between team “A†and team “B†when calculating the opponents’ winning percentage. This simple adjustment keeps the SOS calculation from being skewed in any direction by the team itself. Starting last year, we “stole†this philosophy and started calculating “adjusted wins†which removes the games that a given team lost when totaling their opponents’ wins.
For example, UNC won 14 conference games this year, with two of those wins coming against State. Those two losses are subtracted, leaving UNC with 12 wins, when totaling the wins for State’s opponents. Refer to last year’s entry for a more in-depth explanation.
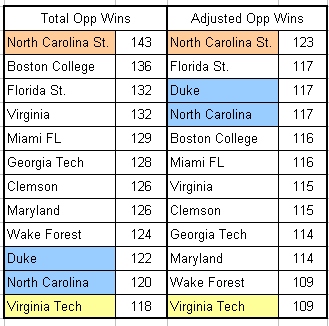
I’ll quit boring our long-time readers now and proceed with this year’s results:
Anyone that knows their way around a spreadsheet is welcome to check my results and report any errors. The total wins calculation is nice in that there is some built-in, error checking ability. As far as I can tell, no such capability exists with the adjusted win calculations. In any event, I really don’t think that there are any mistakes here (have you ever known me to be bashful about my conclusions?). I would be more than happy to discuss any differences that anyone comes up with or any questions about the technique.
Now for a few observations:
– For the second, consecutive year, State ended up with the hardest schedule. Since State was scheduled to play Duke, UNC, and Clemson twice each this year, a lot of people have been expecting this result ever since the schedules were announced.
– Notice how UNC and Duke’s positions changed after calculating the adjusted wins. File this observation under “giving the devil his dueâ€.
– Interestingly enough, the hardest and easiest schedules didn’t change after calculating the adjusted wins.
– Ignoring NCSU, WF, and VT for a moment, the remaining nine teams have remarkably even schedules. This cluster of nine teams is tighter than anything we’ve seen before.
Let’s look at a few issues associated with SOS:
Does the NCAAT Selection Committee Consider SOS?
Probably not directly. As discussed above, a team’s RPI calculation includes a SOS component and we have discussed before how the RPI affects NCAAT selections. But there are several problems with attempting to give SOS a higher weight in the selection process:
– How would you propose to give someone credit for playing tough teams, but losing?
– How can losing to good teams be considered a positive accomplishment?
– Do you expect the Selection Committee to project more wins into the record of a team that played a tough schedule?
Bottom Line: Who a team plays doesn’t necessarily tell you very much about how good a team is.
Who you beat is what tells you how good a team is. Referring once again to the Dance Card, wins again top-25 and top-50 teams as well as conference wins clearly correlate with getting an at-large bid to the NCAAT. So it appears obvious that the Selection Committee does look at SOS in that they consider wins against top teams when selecting the at-large bids.
A further example can be shown with the seeding that UVA received last year. UVa finished tied with UNC for the regular-season conference title (in part because they had the easiest schedule last year) and was seeded much higher than expected from their RPI. This episode strongly suggests that the Selection Committee seeded UVA based on their conference wins, without bothering to see who those wins came against. (Note that State received a similar, but significantly smaller, boost in seeding in 2004.)
Will the ACC ever return to a round-robin schedule ?
The simple fact that this comes up over and over again proves that you just can’t fix stupid. About the only recurring topic that is sillier than suggesting a 22 game conference schedule is the assertion that State must leave the RBC Center and return to Reynolds.
Based on some reports from about this time last year, the ACC may go to an 18-game schedule with the next TV contract. In other words, the ACC will play more conference games if someone will pay for it.
Is FSU in danger of missing the NCAAT because their conference schedule was one of the strongest? Is VT on the verge of making the NCAAT because of their easy conference schedule?
This issue (actual or theoretical) is what generally drives the discussion of conference SOS. So let’s examine this from two different directions.
1) It’s not hard to evenly divide the ACC into three separate groups this year….the Upper 25% (UNC, Duke, Clemson), the Bottom 25% (State, UVA, BC), and the middle 50%. Since FSU and VT both fall into the middle 50%, it should be fairly easy to make some more detailed observations about the relative strength of their schedules.
If you look at the games these two teams played against the top 25% of the conference, we see that VT played the absolute minimum number of games against these three teams, while FSU played five games. Thus these two extra games against the top of the conference explain the two-game difference in FSU and VT’s records….doesn’t it?
Well, not exactly. Let’s take a closer look at VT and FSU to see where their wins and losses came from:
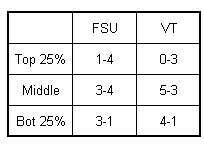
It would be impossible to argue that a significant difference in schedule difficulty doesn’t affect a team’s W/L record. However by taking a little closer look at the schedule breakdown, we see that FSU’s history of inconsistent play is evident again this year. FSU’s position on the bubble has a lot more to do with losses to USF (#168), Providence (#98), NCSU (#95), and two losses to WF(#87) than their four losses to UNC, Duke, and Clemson.
2) I was expecting VT to have a rough year…but they’ve played hard and won more games than nearly anyone outside of B’burg would have thought likely. However, their 0-6 record against the RPI Top-50 really puts their record into perspective. I think that even the most ardent Hokie fan would have to admit that they wouldn’t be nearly as close to making the NCAAT if they had played a significantly harder ACC schedule.
To be honest, I’ve delayed this entry several days trying to figure out what the final answer to this FSU/VT issue is. So far I’ve come up with the following:
– There is no practical way to even out the conference schedules.
– Whining about unbalanced conference schedules (or ACC expansion) is a waste of time.
– Projecting wins or losses based on a hypothetical schedule is worthless.
– Even though it is impossible to quantify, a significant difference in SOS will affect a team’s W/L record and thus will affect a bubble team’s standing come Selection Sunday.
So I have come up with a conclusion that is less than completely satisfying….blaming a trip to the NIT on your conference schedule is a lot like blaming a loss on the referees. Piss-poor referees can (and do) have an influence on a game…but they are not the only reason that your team lost.
HISTORICAL PERSPECTIVE
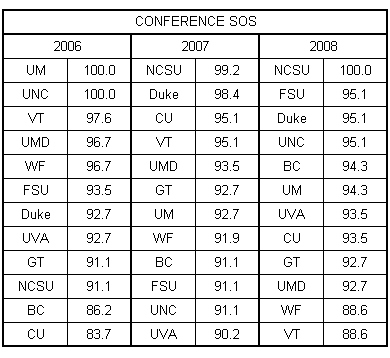
For our three-year summary, I decided to normalize the results against the toughest schedules seen during the 12-team ACC era.