
As soon as ACC expansion eliminated the round robin basketball schedule, it was always obvious that the strength of the conference schedule would vary from one team to the next. The open questions were always:
- How much would SOS vary from one year to the next?
- Would certain teams tend to get easier/harder schedules year after year?
- How much did the variations in schedule strength impact the current season?
For those that haven’t followed the details of building an ACC schedule, for 18 games against 14 opponents each team’s schedule consists of:
- Two designated rivals that they play twice every year (State’s rivals are UNC and WF.)
- Two rotating opponents that they play twice this year
- Five home games
- Five away games
My starting assumption was that having two designated rivals would tend to skew the schedule difficulty for certain teams. For instance, ND has BC and GT as their two rivals, while L’ville has ND and SYR. But this tendency can either be offset or compounded by the two rotating rivals for a given year. But speculation is pretty useless if you don’t bother to check your assumptions…
ACC STRENGTH OF SCHEDULE
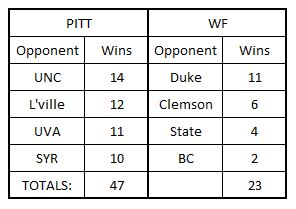
For the past several years, I’ve been calculating ACC SOS based on the four opponents that each team plays at home and away. As way of illustration, let’s look at the hardest and easiest schedules this year:
In graphical format, here is the SOS ranking for the entire conference:
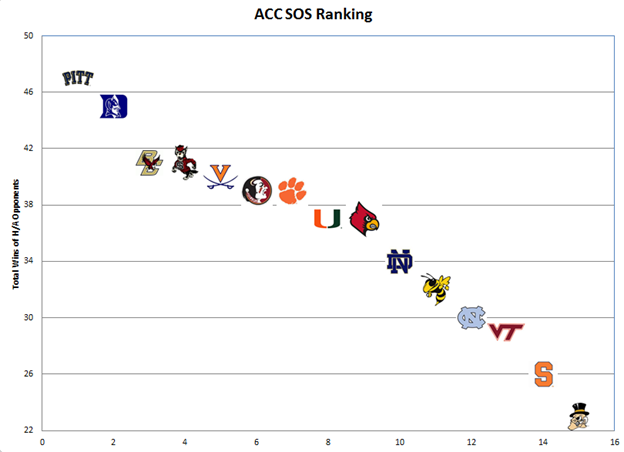
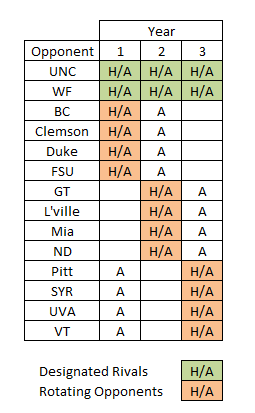
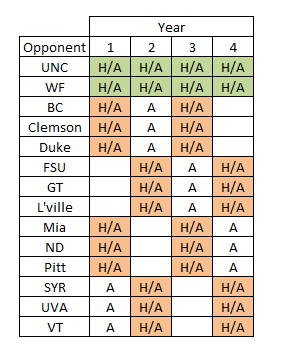
So looking at the bottom third of the conference, we can see that we have four bubble teams (stretching the definition a little) and UNC. So if my system has any merit, those teams will warrant a closer look. So let’s look at the master ACC schedule and check my ranking system qualitatively:
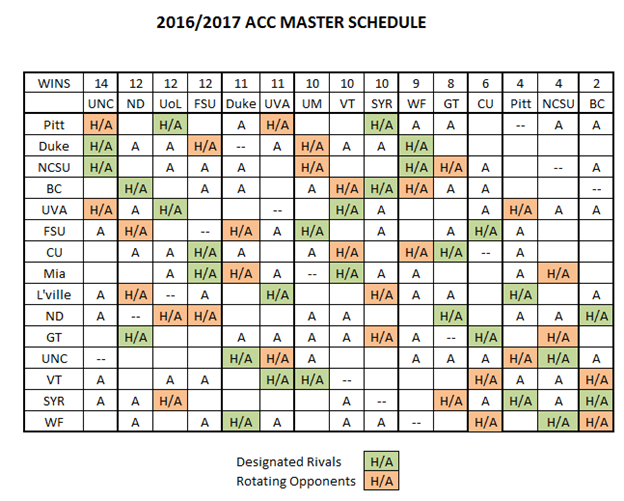
(Read along the rows to see where a game was played. For instance, Pitt played ND at home.)
So the rows are sorted by schedule difficulty (as shown in graph) and the columns are sorted by ACC wins. So we can use the table to quickly see if the graph of hardest to easiest schedules makes sense:
- The harder ACC schedules will have multiple games against teams to the left (ie more wins) and few/none against those in the right columns. For instance, UVa is the only team in the top half of the conference in schedule difficulty with an H/A opponent in the bottom three.
- The easier ACC schedules will have their multiple games clustered in the lower right corner of the table.
So we can quickly see that on a gross basis, the sorting of conference schedule difficulty makes sense.
Before we move away from this table, let’s talk a minute about an aspect of schedule difficulty that is not included in any strength of schedule calculation that I know of. Specifically, the location of the game frequently has a tremendous impact on the odds of winning that game.
We specifically talked about UNC and WF at the half-way point of the ACC schedule and how their respective schedules were lining up. UNC’s schedule is as easy as could be imagined considering that they are playing two of the teams that were locked into NCAAT bids from the start of ACC play. Look at where their games against the toughest opponents were played…in Chapel Hill. Considering that UNC lost at GT and at Miami (along with losses in Durham and C’ville), it seems obvious that their ACC record was bolstered by playing their toughest opponents at home.
WF’s schedule outlook also remains the same as it did at the halfway point of the season. They had an easy schedule based on playing home/away games against three of the worst four teams in the ACC. But their schedule doesn’t help a bubble team out much since they play most of their hardest opponents on the road. Since WF was woefully shy in the Top 50 wins category, I’m glad that they put together a great week to finish the regular season.
GT and SYR ended up on the bubble and you have to think that their schedule certainly helped their win total in the ACC. (But that doesn’t take anything away from the impressive home victories that both teams racked up.) But if they couldn’t beat teams in the bottom half of the conference on the road, then they probably didn’t deserve to make the NCAAT anyway. (I guess that SYR still has a slim chance at a bid, but I stand by my conclusion.)
VT fared a little better since they didn’t stumble as badly on the road as GT and SYR. They might not have fared as well against a tougher schedule, but we’ll never know.
HISTORICAL ANALYSIS
Here is a graph that summarizes the first four years of the 18 game schedules in the 15-team ACC:
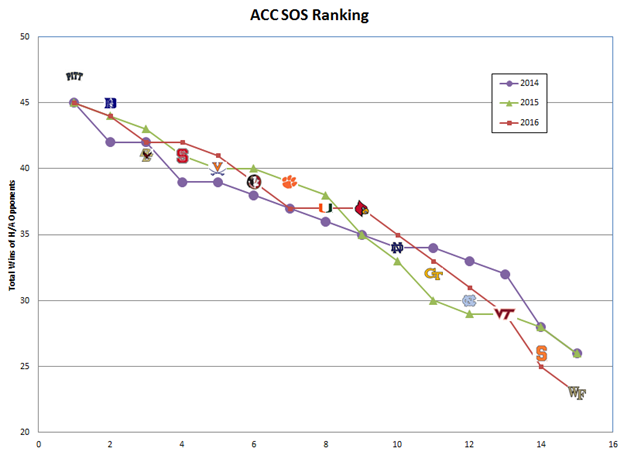
Observations:
Pitt set a record for the hardest schedule since the ACC expanded to 15 teams. They would have been even further out front if not for the late season stumbles by SYR and UVa.
WF tied last year’s ND team for the easiest conference schedule in the 15-team ACC era.
The slope from hardest to easiest schedule is fairly consistent from one year to the next…meaning that some teams are always going to get a substantial boost in the conference record due to the unbalanced schedule.
Let’s break the conference in thirds and look at the teams in the top third (hardest) and the bottom third or easiest schedules:
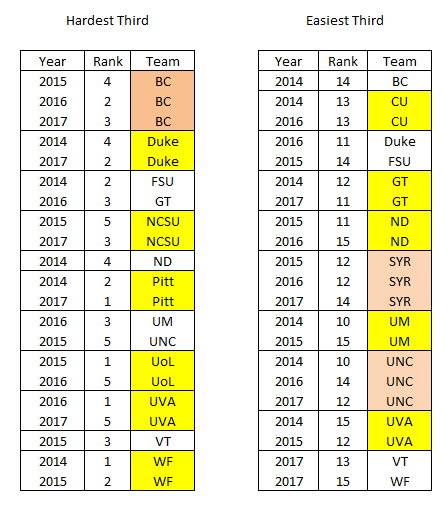
I highlighted those teams that appeared two or three times in either list. A few observations:
This year was VT’s and WF’s first time in the easiest third.
Clemson and Syracuse have never been in the hardest third. NCSU, Pitt, and L’ville have never been in the easiest third.
Without a doubt, the most frequently misused statistical function is “average”. To be honest, I can’t tell if this is another example of misuse or not. But in any event, here is each team’s average schedule ranking over the last four years. Since a ranking of eight would put you in the middle of a 15 team league, I highlighted those teams that average within one place and two places of dead center:
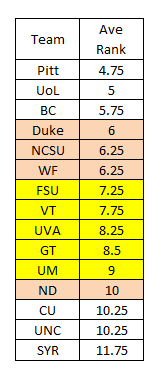
I think that the last two tables show that the schedule difficulty is not “evening out over time”. We have a pretty poor system for setting up the conference schedule and any claims to the contrary don’t seem to have much of a leg to stand on. The only way that it will change is if the TV money forces a change…which is supposed to happen when the ACC Network launches. (But since I can’t consistently get the games on the ACC affiliates now, what are the chances that my cable system will carry the ACC network?)
SYSTEM WEAKNESSES
Looking at my system objectively, there are two potential weaknesses of my approach:
- There is going to be a general tendency for the worst teams in the conference to have harder schedules because they gave a bunch of wins to the four teams that they played twice.
- The wins that a team gets against a weak conference schedule might inflate the actual difficulty of playing that particular team.
I try to minimize those potential weaknesses by concentrating any discussion on teams fighting for a two-round ACCT bye and teams just on either side of the Bubble. I rarely mention the schedule difficulty of the teams at the bottom, since pretty much any ACC schedule would be difficult for them.
On the flip side, it’s worth noting that for all of the troubles Duke had this year, they ended up with a better than respectable ACC record against one of the most difficult schedules in the conference. Their four home/away opponents all finished at 0.500 or better in the conference and their home games were against the five worst teams in the conference…..which obviously means that they played their toughest one-time opponents all on the road. I despise all of the BS with NCAAT brackets, but If I did one I would push Duke further along in the bracket than many might.
RPI CALCULATION
Many of the weekly updates have included a column for conference SOS based on national rankings. From the Last Look at the Bubble, we can compare the rankings from the RPI calculation with my system:
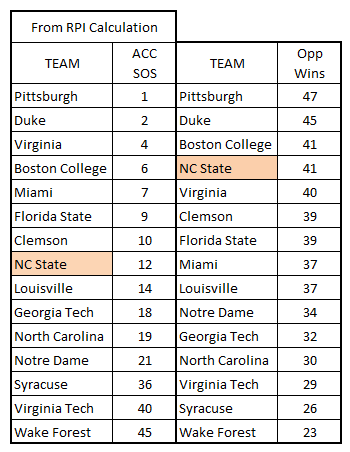
Take a moment and look at the NATIONAL rankings of the conference schedules:
- Seven of the Top 10 toughest conference schedules are in the ACC.
- 12 of the Top 25 toughest conference schedules are in the ACC.
When you consider how clustered together the top of the conference is even with 300+ teams in the RPI rankings, then the only conclusion you can reach is that there really isn’t all that much difference from one schedule to the next this year…until you get close to the bottom of the conference.
I noted that State’s ranking varied the most between the two ranking systems. But with the way this season has gone, it just wasn’t worth taking any time to figure out exactly why.
While the RPI calculation somewhat avoids the issues with my system, it comes with its own set of issues. Specifically, the OOC schedule of each team will impact how that team measures up against its conference opponents. For instance, WF had a really tough OOC schedule while VT, Miami, and GT all had dreadful OOC schedules. Thus with the RPI calculation, WF will be judged as a tougher opponent when compared to teams with better ACC records….AND WF lost every OOC game against Top 50 teams.
So I don’t care which system you use to determine conference SOS, there will be issues. The key is not necessarily eliminating all issues, but to understand them so that you don’t make conclusions beyond what the data will actually support.
20 GAME ACC SCHEDULE
Back when the ACC Network was announced, it was reported that the ACC would be going to a 20 game conference schedule when the ACC network launches. I haven’t seen anything recently on that, but I thought that it would be worthwhile to take a look at what a 20 game schedule would look like now that we’re all up to speed on the 18 game schedule. So here is an example of what State’s schedule might look like:
Obviously I have no idea how they will group State’s rotating opponents, but this table broadly illustrates what it will likely look like. By adding two more home/away opponents to the schedule, the delta between the hardest and easiest schedule should shrink. It will be interesting to see how far back in December the first ACC games will push when you consider breaks for exam weeks, different exam weeks between schools, holiday tournaments in places with warm ocean breezes, Christmas break for the players, coaches, and staff, and anything else I’ve forgotten.
Not that it’s likely to happen anytime soon, but I thought that I would throw up a 22 game schedule just for kicks:
Now that’s a schedule that would really tend to even out the schedule difficulty.
