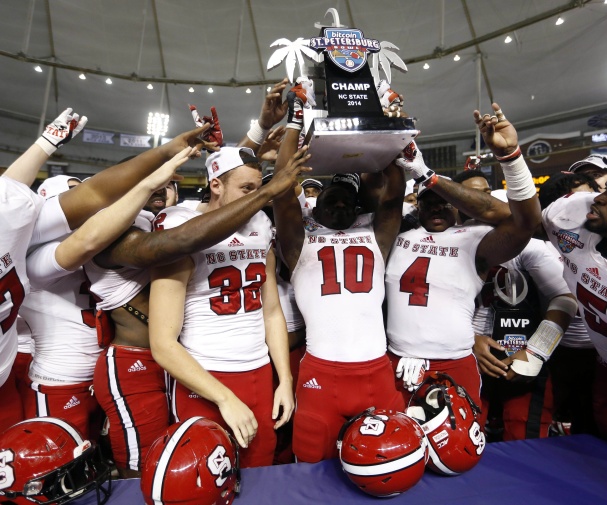
Here are the stats and national rankings after the Wolfpack’s bowl win and the national championship game.
While Ohio State won the championship on the field, here is how the mythical National and ACC championship belts ended up at the end of the season.
National Heavyweight Championship: TCU holds the national championship belt at the end of the season. TCU defeated West Virginia to win the belt, defended it against K State, Kansas, Texas, Iowa St and Ole Miss in the Peach Bowl.
ACC Heavyweight Championship: Florida State had the ACC belt the entire season and has held the belt since December 2012 (773 days).
Team Stats – ACC & National Rank in Parentheses
NC State finished in the top 25 in the following categories:
Blocked Punts Allowed – 1st
Fewest Penalties Per Game – 23rd
Kickoff Return Defense – 23rd
Net Punting – 14th
Interceptions Thrown – 9th
Tackles For Loss Allowed – 11th
Tackles For Loss – 24th
Turnovers Lost – 16th
Offense
Scoring Offense: 30.2 (8, 55)
Total Offense: 408.5 (6, 57)
Rushing Offense: 204.5 (4, 37)
Passing Offense: 204.0 (9, 82)
Passing Efficiency: 134.90 (7, 50)
Interceptions Thrown: 6 (1, 9)
3rd Down Pct: 45.8% (3, 26)
4th Down Pct: 50.0% (7, 58)
Red Zone Offense: 86.5% (5, 41)
First Downs Offense: 282 (6, 49)
Sacks Allowed: 2.23 (11, 80)
Tackles For Loss Allowed: 4.54 (4, 11)
Turnovers Lost: 15 (2, 16)
Defense
Scoring Defense: 27.0 (13, 65)
Total Defense: 373.1 (10, 46)
Rushing Defense: 168.4 (10, 65)
Passing Defense: 204.7 (7, 30)
Passing Efficiency Defense: 121.54 (6, 42)
Interceptions: 10 (9, 82)
3rd Down Pct Defense: 48.5% (13, 121)
4th Down Pct Defense: 60.0% (11, 90)
Red Zone Defense: 80.0% (7, 43)
First Downs Defense: 269 (10, 74)
Sacks: 2.31 (7, 48)
Tackles For Loss: 6.9 (4, 24)
Turnovers Gained: 20 (10, 65)
Other
Turnover Margin: 0.38 (5, 37)
Net Punting: 40.45 (3, 14)
Fewest Penalties Per Game: 4.85 (3, 23)
Fewest Penalty Yards Per Game: 42.92 (5, 32)
Time Of Possession: 29:29 (8, 71)
Kickoff Returns: 18.28 (13, 118)
Kickoff Return Defense: 18.81 (5, 23)
Punt Returns: 3.65 (14, 121)
Punt Return Defense: 7.75 (11, 71)
Attendance
Total: 380,785 (4, 31)
Average: 54,398 (5, 36)
Pct Capacity: 94.47% (4, 36)
Schedule Strength
Cumulative Opposition: 73-56 .566 (5, 29)
Individual Stat Leaders
Rushing
Shadrach Thornton: 164 att, 907 yds, 5.5 avg, 9 TD
Matt Dayes: 104 att, 573 yds, 5.5 avg, 8 TD
Jacoby Brissett: 124 att, 529 yds, 4.3 avg, 3 TD
Tony Creecy: 52 att, 282 yds, 5.4 avg, 2 TD
Jaylen Samuels: 15 att, 143 yds, 9.5 avg, 1 TD
Passing
Jacoby Brissett: 221-370, 2606 yds, 23 TD, 5 Int, 59.7% comp pct, 136.70 rating
Garrett Leatham: 1-6, 8 yds, 1 Int
Bo Hines: 1-3, 20 yds
Shadrach Thornton: 1-1, 20 yds, 1 TD
Receiving
Bo Hines: 45 rec, 616 yds, 13.7 avg, 1 TD
David J. Grinnage: 27 rec, 358 yds, 13.3 avg, 5 TD
Bra’Lon Cherry: 27 rec, 354 yds, 13.1 avg, 3 TD
Matt Dayes: 32 rec, 321 yds, 10.0 avg, 5 TD
Marquez Valdes-Scantling: 22 rec, 257 yds, 11.7 avg, 1 TD
Punt Returns
Bra’Lon Cherry: 6 ret, 35 yds, 5.8 avg
Bo Hines: 9 ret, 31 yds, 3.4 avg
Kickoff Returns
Matt Dayes: 21 ret, 384 yds, 18.3 avg
Dakwa Nichols: 11 ret, 217 yds, 19.7 avg
Field Goals
Niklas Sade: 12-17 (.706), long of 48
Extra Points
Niklas Sade: 46-48 (.958)
Punting
Wil Baumann: 60 punts, 45.4 avg, long of 67, 23 inside 20yd line
Kickoffs
Niklas Sade: 74 KO, 63.6 avg, 47 touchbacks
Fumbles
Jacoby Brissett: 10 fumbles, 7 lost
Shadrach Thornton: 3 fumbles, 1 lost
Matt Dayes: 2 fumble, 0 lost
Bra’Lon Cherry: 1 fumble, 0 lost
David J. Grinnage: 1 fumble, 0 lost
TEAM: 2 fumbles, 1 lost
Tackles
Hakim Jones: 80
Jerod Fernandez: 78
Rodman Noel: 76
Dravious Wright: 57
Josh Jones: 56
Tackles For Loss
Mike Rose: 15
Rodman Noel: 12
Art Norman: 9
Thomas Teal: 8
T.Y. McGill: 8
Sacks
Art Norman: 6.5
Mike Rose: 5
T.Y. McGill: 3
Thomas Teal: 3
Brandon Pittman: 3
Interceptions
Josh Jones: 4
Jerod Fernandez: 2
Rodman Noel: 1
Jack Tocho: 1
Pharah McKever: 1
Juston Burriss: 1
Forced Fumbles
Mike Rose: 3
Dravious Wright: 2
Thomas Teal: 2
Fumbles Recovered
Mike Rose: 2
Monty Nelson: 2

You must be logged in to post a comment.