The Age, Experience, & Talent (AET) Index is a quantifiable look at the each ACC team in 5 different categories:
(1) Class Size (Percentage of team that are Jr/Sr)
(2) Returning Starters (Percentage of starters that are returning from previous year(s))
(3) Returning Lettermen (Percentage of players who have received a Letter)
(4) Depth Chart (Percent of 2-deep players who are Jr/Sr)
(5) Talent Points (Summation of Star points of the Depth Chart)
Background:
The AET Index started with me comparing the class sizes of NC State and UNC’s football teams. When the UNC-Spin-Machine came out year after year of proclaiming how “young†the baby Tarheels were, I decided to look into how young they really were. The spin was so bad that I started noticing a lot of commentators during games (any game) always saying that “So and So team is EXTREMELY Young this yearâ€. Shortly after completing this, SFN did a piece on the very same subject (great article btw). I decided to expand my work and look at the entire ACC. I again expanded it to include Returning Starters, Returning Lettermen, and Depth Chart. I published my results for the years of 2006-2009 to point out the shear stupidity of the media and the blatant lies of the UNC Spin Machine.
One commenter then chimed in that even though Miami (2009) was one of the older, most experienced teams in the ACC that year, their “talent†was all young. So I decided to expand one more time to include “Talentâ€. While admitting that we all know recruiting rankings are anything but an exact science, I figured it was worth including since the rest of this exercise isn’t 100% accurate either. So I’ve compiled is a breakdown of each ACC team from the 2006 – 2009 seasons using each of the 5 categories previously stated.
How I developed each Category:
1. Class Size:
I used the official roster listed in the ACC media guide for each team. To eliminate walk-ons I used the committed list of players for each recruiting class on Scout.com dating back to 2002. If a player was listed on the committed list for that years class and wasn’t on the official roster for that year he wasn’t included. Accuracy of numbers is based on the accuracy of the official roster and commitment list.
I wasn’t able to distinguish between Redshirt and Non-Redshirt players for everyone so I didn’t do it for anyone. So if it says Jr that is both true and redshirt. What I did do is include the number of freshmen that did make it from the incoming recruiting class (IC) and that’ll help with the large number associated with freshmen to differentiate between true and redshirt.
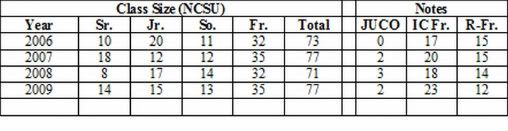
Ex. NC State
Ex. ACC 2009
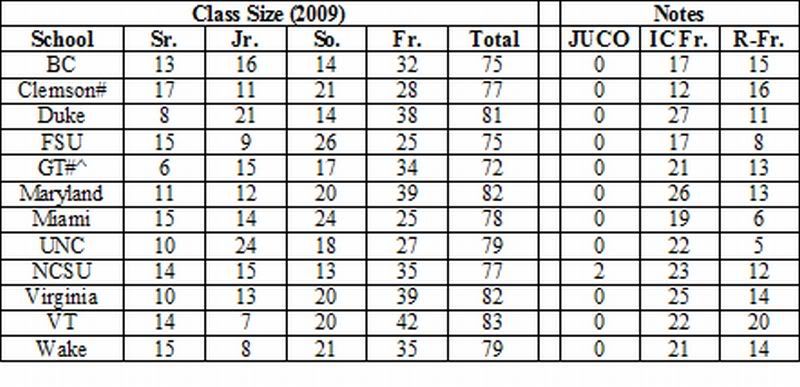
As you can see due to the large number of True & Red-shirt Freshman, plus the sophomores, every team, every year, should have a “Young†team. So the response should be, “So what!! How does it compare to everyone else and how many of the Starters/Backups are young & inexperienced?â€
Here is something else no one seems to notice, players are weeded out during the first 2 years. How many times do you see players transfer from schools because they discover they can’t compete at that level?
2 & 3. Returning Starters/Lettermen
These 2 categories were pretty straightforward. Looking at media guides this data was provided. For Starters I simply calculated the percentage of returning starters, not including specialists. For Lettermen they provided the number of returning lettermen and lost lettermen.
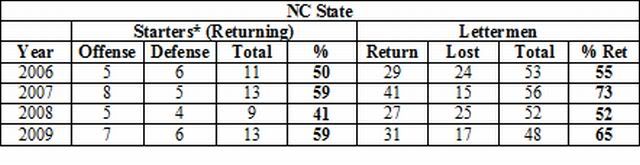
Ex. NC State
Ex. ACC 2008

(Starters data was collected from theacc.com media guides. The Lettermen data was collected from School MediaGuides, ACC Media Guide, & Collegefootballnews.com.)
4. Depth Chart
Depth Charts are a look at a break down at the beginning of the season to determine how young a team’s 2-Deep is by separating Jr./Sr.’s and Fr./So.’s.
(Depth charts were taken from Collegefootballnews.com for the years 2006-2008 with the exception of VT 2006 which was obtained from techsideline.com. Placekickers and Punters were included but only counted once if they performed both duties. Some teams didn’t provide, or have, backups for the PK & P.)
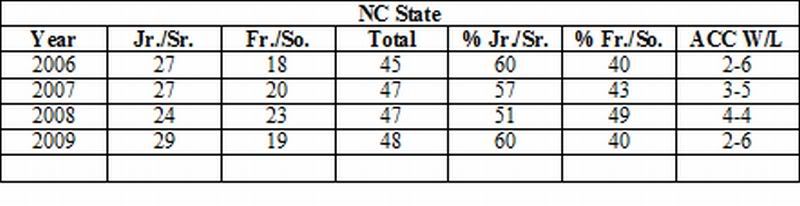
Ex. NC State
Ex. ACC 2009

So far everything has been as objective as you can be. The only errors at this point are due solely to inaccurate raw data provided by whoever published the documents. One error that would affect every team is incoming freshmen listed on the media guides but who did not make it to campus that season. I tried my best to weed out what I could but could not find all errors. The total affect should be minimal at best considering the small number of players who didn’t make it on campus and the total number of scholarship players.
Now some people will say that a team will experience injuries (Hello Pack fans) throughout the year and it will affect their percentage for this category. Yes, the injuries throughout the season will affect a team’s depth chart but after following the ACC last year the affect was so minimal that even a cursed team didn’t change their ranking throughout the season.
Up next is what is the hardest to justify due to the subjectivity of the category but needs to be figured in to the equation somehow.
5. Talent
To calculate talent level for each team I figured the best way (though not accurate) is to look at each team’s depth chart and assign a point for every star each player received in high school. So each player who received 5 stars was assigned 5 points, 4 stars equals 4 points, etc., and walk-ons equals 1 point. I then summed up the points for the entire depth chart (not including specialists).
Ex. NC State
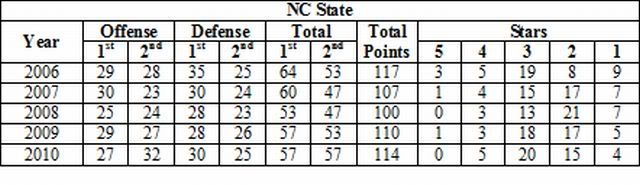
Ex. ACC 2009

The rankings were obtained from Scout.com.
The AET Index:
Now that we’ve calculated each of the 5 categories for every ACC school, we can rank each team 1 through 12 (highest percentage, highest point total to lowest) for each category, and then average out their ranking for their final Index number.
# = Division Champion
^ = ACC Champion


Conclusions:
There is no guarantee that having a low AET Index number (close to zero) is going to equal more wins, there are just too many other factors involved besides Age, Experience, & Talent. The only year that appeared to fall into place for the AET Index was 2009. 2008 was flat line and 2006/2007 was scattered. One thing that is interesting is the high turnover of coaches after the 2006 (Miami, UNC, NCSU) & 2007 (Duke, GT) seasons.
In the end the AET Index number is good for seeing how “Young†a team actually is but due to small sample size (too few games per season and only 4 years of data) it’s not a good indicator of W/L record. Also, all the other factors that go into a winning team are not factored in; coach, QB, OL, talent on one side of ball and not the other, schedule, etc.
Using AET Index to evaluate Coaches:
One thing I did think of when determining how to use the AET is in a game by game comparison of team’s index’s, calculating a home field advantage, and breakdown of how “good†a coach is by winning with what they have.
For example, 2009 season, Boston College (5.6) at Clemson (4.0). Clemson should win the game having a lower AET Index number. They did win so a home win was counted. I did this for every ACC game for the 2006-2009 seasons. I calculated a Home Field Advantage (HFA) factor as follows:
2006, GT (3.2) at Clemson (5.0). Clemson is the underdog at home and won. A difference of 1.8. I then added all games that resulted in the underdog at home winning and divided by the total number of games played at home by underdogs. This resulted in a HFA of 1.6 using seasons 2006-2008.
Now you apply the HFA for each home team. For example, 2009 season, VT (5.4) at GT (5.8) is recalculated with the HFA as, VT (5.4) at GT (4.2). GT goes from the underdog to the favorite due to playing at home. GT won the game.
Now you add up everyone’s records in the following categories:
Favorites Away
Favorites Home
Underdogs Away
Underdogs Home
Now you assign the following point system:
Favorites Away, every Loss equals -0.5 pt (no +pt for winning as favorite)
Favorites Home, every Loss equals -1.0 pt
Underdogs Away, every Win equals +1.0 pt (no –pt for losing as underdog)
Underdogs Home, every Win equals +0.5 pt
You get the following results (by coach):

Conclusion:
Just because a coach is on the plus side doesn’t mean he’s successful and should be retained. Neither does being on the negative side mean they are unsuccessful and should be fired. All it is saying is that, using the AET Index as the barometer, is the coach doing the best with what he has or not. Now is what he is doing due to his own creation? That’s something else all together and is another point for discussion.
No shock Beamer is the best coach by winning when he should and having a good winning percentage when he should lose. Johnson after 2 years has done very well by being an underdog predominately and winning while not tripping up the few times he’s been the favorite. Friedgen is showing that he is underperforming, would have been nice to have the data to look at his entire time at Maryland and track it by year, as well as TOB at BC.
Looking at the class of 2007 coaches, TOB has done more with what he has than Davis & Shannon. Though I don’t think anyone is delusional to think that we’re on the way up and UNC/Miami aren’t. Their problem is game day coaching, State’s is having the enough of the right players.
One thing you can do is take a coaches’ winning percentage from one of the 4 record categories and then apply it to each game to give you an idea of their chances for an upcoming game and the AET Index with HFA factored in for the season. Which I will be doing when the 2010 information comes out later, unfortunately depth charts are released until right before the first game so I probably won’t get 2010 out until after the first weekend. I’ll see at the end of the season just how good of a predictor it can be.
Remember, this is just a different way at looking at a team’s performance and evaluating coaches. It’s something that is out-of-the-box. I’m not saying this is a perfect system, just a different one. The data is as accurate as I could possibly make it with the materials available. I’ve checked, rechecked, and triple-checked my numbers to the point that I’m 99.9% certain what I have presented is correct.
Next week…ACC AET Index (2010)
