
Ever since the ACC got too large to play a round-robin conference schedule, it was obvious to me that some teams would play a harder conference schedule while others would play easier ones. So I’ve made an effort to analyze the various conference schedules and pick out those teams with easy or hard schedules to see how the variations in schedule strength impacted the conference standings and NCAAT bids.
I’m doing this breakdown before my “Final Look at the Bubble” (ie the last weekly summary of ACC basketball) for reasons that will be obvious by the time you get to the end of this post.
TECHNIQUE
My current technique of analyzing schedule strength looks at the four opponents that each team plays home/away and totaling their opponent’s conference wins and then sorting the results. If that sentence seems as clumsy to you as it does to me, here are two examples to illustrate:
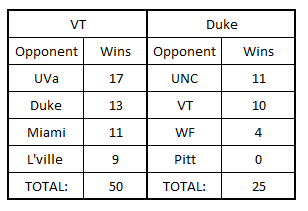
NOTE: VT set the record for the highest number of opponent wins over the 5 years that I’ve been doing this. Last year’s Pitt team was the previous record holder with a total of 47 opponent wins.
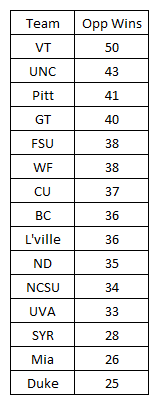
RESULTS
You may have noticed that I like graphs and here’s another one:
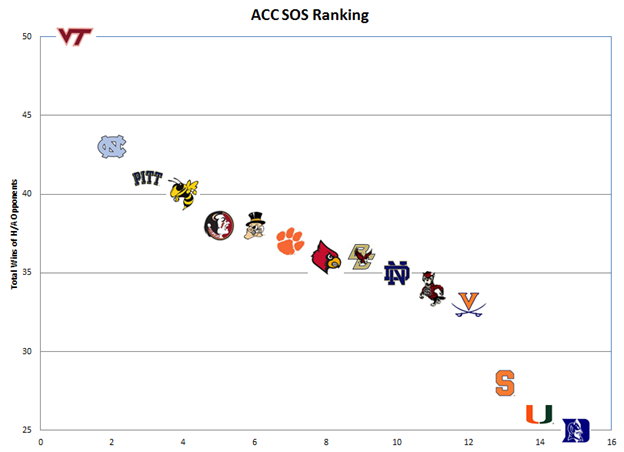
I like the graph because it gives me a feel for how much the conference schedules are varying from one position to the next. For instance, saying that VT had a harder schedule than UNC or saying that UNC had the second toughest conference schedule would both be completely accurate. But neither statement would illustrate how much harder VT’s schedule was.
SIDE NOTE: This is the first year that State found itself in the bottom third in ACC schedule strength.
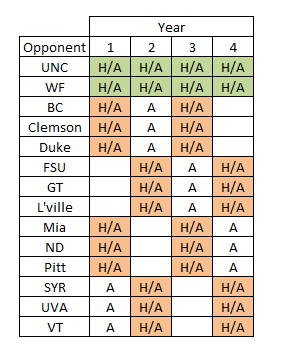
I like to compare the numerical results to the master schedule to make sure the results make sense. So here’s the master ACC schedule:
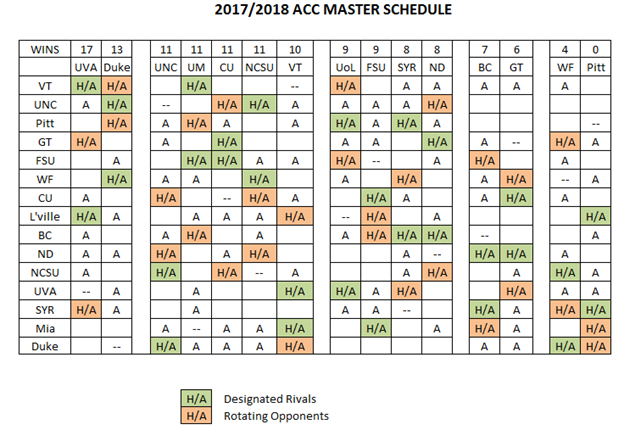
To see where a game was played read across the rows. For instance, UNC played UVa in C’ville.
The columns are sorted by ACC wins and the rows are sorted from hardest to easiest conference schedule. I added some blank columns to arbitrarily break up the conference to help with the visual comparisons.
I’m mostly happy with the ranking, but not completely. I’ve always been afraid that using total wins might skew the rankings when one team runs away with the conference or goes winless (or nearly so). This year we have both and I think that my fear was confirmed.
For instance, compare SYR with Duke. At the weak end, both teams played WF and Pitt so there is no difference there. At the strong end, SYR played UVa and BC twice while Duke played UNC and VT. You would have to say that the odds of going 4-0 against UVa/BC would be worse than going 4-0 against UNC/VT. But with BC as one of the opponents, the odds of going 0-4 would have to be much less than playing UNC/VT. So it’s hard for me to say which schedule is truly harder.
Now compare Miami to SYR/Duke. If I was sorting the schedules qualitatively, I would give Miami the weakest schedule award because they didn’t have to play home/away with any of the teams that won 11 or more ACC games. But this is where the graph places this discussion in the proper context….all three teams played substantially weaker schedules than anyone else. In the end, we want to see which teams had the conference records inflated/degraded based on who they had to play….and my simple system accomplishes that goal.
HISTORICAL CONTEXT
This is the fifth season with 15 teams in the ACC, so it’s only natural to be curious about how this season compares to the past. I’m going to cut the historical discussion back this year to move onto more important things. I’m not absolutely sure that “average” is the best way to summarize the historical SOS results, but I can’t think of a better way. So here’s what we’ve seen over the last five years.
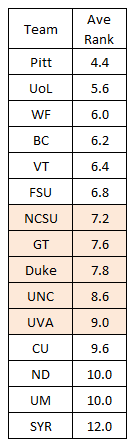
With a 15 team league, a ranking of “8” places you perfectly in the middle of the conference. I’ve highlighted the teams that have averaged within one spot of the middle to illustrate that ACC SOS is not evening out over time.
Basically, everything thing that I written so far has been to say that the defined rivals set up by the conference skews the SOS, favoring certain teams at the expense of others. For instance, when Skip Prosser was at WF, State’s SOS was consistently near the top. With WF falling off since Prosser’s untimely death, State has moved towards the middle.
Likewise, SYR has BC and Pitt as defined rivals. BC has not been competitive since Al Skinner was fired. Pitt has not been that strong since joining the ACC and has fallen to the bottom since Jamie Dixon left.
I can think of two ways to help even out the conference schedule (other than kicking some teams out and going back to a round-robin conference schedule). The most logical solution would be to eliminate defined rivals and completely randomize the schedule rotation. That would obviously eliminate one of the two Duke/UNC games most years….but there is such a thing as a non-conference schedule that each team has complete control of. So while this COULD be done, I wouldn’t recommend holding your breath waiting for it to happen.
While the odds of eliminating the defined rivals are immeasurably small, the other way to even out the schedules is to increase the number of conference games. The more teams that you play home/away, the more teams will cluster around “average”. There were news articles reporting that the ACC was going to increase the conference schedule to 20 games to support the ACC Network. But I haven’t seen any mention of a schedule change recently. I worked out what a 22 game schedule could look like last year and that would be my solution as soon as I’m appointed as ACC Czar.
SO WHAT?
While researching the new quadrant system that will be used by the NCAAT Selection Committee, I decided that this will probably be the last season that I calculate the ACC SOS. That decision was made when I found this little nugget on the NCAA web page that lists the things that the Selection Committee considers:
The Rating Percentage Index (RPI) is one of many factors used by NCAA sports committees when evaluating team selection, seeding and bracketing…Other criteria the committee considers in the selections process are…
…Imbalanced conference schedules and results…
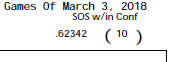
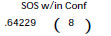
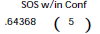
Their take on conference SOS is found in the top right corner of the team sheet used to summarize the game results of each team. The following snip was taken from State’s page to illustrate how the info is presented to the committee.
That little nugget of information obviously requires additional tables and graphs to explore this new (to me) data.
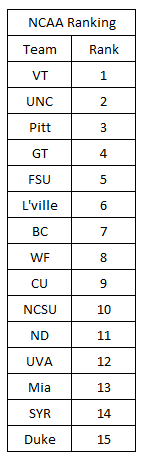
Using the fractional measure of SOS (seen in the snip above) and the ranking, we get this graphical representation:
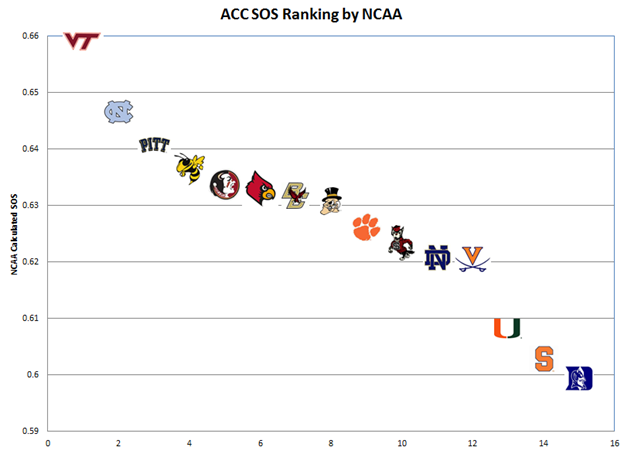
I don’t know exactly how the Selection Committee is going to use the conference SOS in selecting at-large bids. But I’m concerned that the committee is going to miss the value of this graphical representation in favor of a mental image of a straight line when they see that someone ranks high or low in the conference. Clearly, there are teams that are bunched together in the middle along with a few that are considerably harder or easier than the rest of the conference.
FEW MORE COMPARISONS
So I needed to know how the ranking criteria that I pulled out of thin air compared to one that the NCAA is going to use. And while I was at it, I might as well include the ESPN calcs that we’ve watched all season:
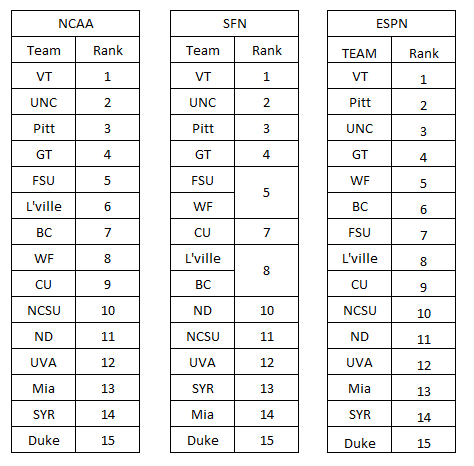
I was happy to see that my quick and dirty ranking got the whole conference within two spots of what the NCAA is going to use. Since ESPN isn’t duplicating the NCAA’s RPI calculation, it pretty much means that they are not going to match anything else.
ESPN’s calcs are not far off, but I generally strive for accuracy. But in ESPN’s case, they are the only on-line source that I’ve found that will let me quickly get an RPI summary table together for the weekly update posts. In this case, convenience and speed win out over accuracy.
I sort of assumed/hoped that the NCAA would rank conference SOS based only on the conference results. But those hopes were dashed when I looked at two teams in the Big 12, which still plays a complete round-robin schedule:
|
Kansas |
Oklahoma |
|
|
|
So basically we know that the Selection Committee is going to look at conference SOS, but we don’t know exactly how they calculated the SOS nor do we know exactly how/when they are going to use it. All of this just complicates what is a difficult process to unravel in the first place. But as I like to say….If it were easy, then anyone could do it.
WRAP UP
If you’ve been around here for our bubble discussions over the years, it has become apparent that teams with losing conference records need to make up ground in the ACCT if they want an NCAAT bid. But if I were going to use the conference SOS data, I would be more receptive to cutting VT some slack with an 8-10 conference record (and nothing of note in the ACC tournament) than I would with Syracuse…which just by coincidence is the question we need to resolve in the Last Look at the Bubble. Exactly what does ND and SYR need in the ACC tournament to secure an at-large bid with a regular season 8-10 record?
Think about that question and I’ll try to get the last weekly summary up tonight. Also link any pertinent articles that you run across as the bubble gets talked about a lot over the next week.
