Parity in College Basketball

During one of the studio sessions this past season ESPN posed the question, “Have the mid-major schools reached parity with larger schools?” to Digger and Bilas.    Digger chose to argue for parity using Butler and Wichita State as proof.   Bilas argued against mostly by saying that parity required more than just two examples.    The time frame for this discussion was probably about the time that Bilas wrote this article for espn.com.

I think that the question is a good one, but the issue was poorly handled by the talking heads (shocking huh?).     Before tackling the issue, both “parity” and “mid-major” should be defined to insure that the both sides have the same goal in mind.   For instance, most people would agree that Creighton was a good mid-major program when they were in the MVC.     But did moving to the Big East (while staying in Omaha) upgrade their status or not?    Since I’m not actually arguing with anyone, I’m going to leave these two issues open (and continue to count Creighton as a mid-major) and you can argue with my conclusions using whatever definition you want.

Let’s start by looking at parity on a global scale by looking at the Final Four participants and their RPI rankings.   If there is actually parity in college basketball then we should see a consistent, wide-range of rankings show up in the Final Four.   If on the other hand, college basketball is dominated by the powerful few, then the range of rankings would be rather narrow.

RPI in Final Four

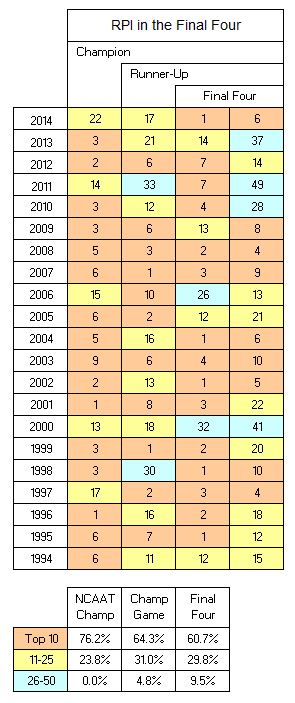
Let me explain the small, summary table to prevent misunderstandings.   The “NCAAT Champ” column should be self-explanatory and covers the 21 champions.   The “Champ Game” column covers the 42 teams that played in the championship game over the years listed.   The “Final Four” column includes the 84 teams to make the F-4 since 1994.

I started this table back in the days of the Great Herb Debate to prove that teams don’t move from mediocrity to stardom in the NCAAT.    90% of the teams that made the Final Four over the last two decades were also ranked in the RPI Top-25 and 60% were ranked in the RPI Top-10.  In other words, there is no such thing as parity in college basketball.   The elite teams dominate both during the regular season and in the NCAAT.


Rabbit Trail

The correct interpretation of this table is that the large majority of the Final Four teams can be found in the RPI Top-25 (which is finalized before the NCAAT starts).    That does not mean that all 25 teams are serious contenders for a spot in the Final Four.     A recent article by 1.21JW shows how to delve deeper in the stats to separate the contenders from pretenders.

JW and I have swapped a number of e-mails over the last week.   He is looking deeper into to the stats to show the common traits of Final Four teams.    My analysis is much simpler.

–        You have to win a bunch of games to reach the Final Four.

–        Any team that wins a bunch of games will rise to the top of the RPI Rankings (or any other ranking that you prefer).

–        The accuracy (complexity?) of your preferred ranking system might tighten up the ranges, but RPI is sufficient for my needs.

I haven’t seen JW’s last two entries on this subject, but I think that our entries will be complementary rather than contradictory.   Now, back to parity.


Since the first table shows the importance of being in the Top-25 (or better yet, Top-10), it seems logical to look into how many mid-majors have recently made that milestone.   The following two tables compile the teams with RPI Top-10 and Top-25 rankings over the last five years:

Top_10_Five_years

Top_25_Five_years

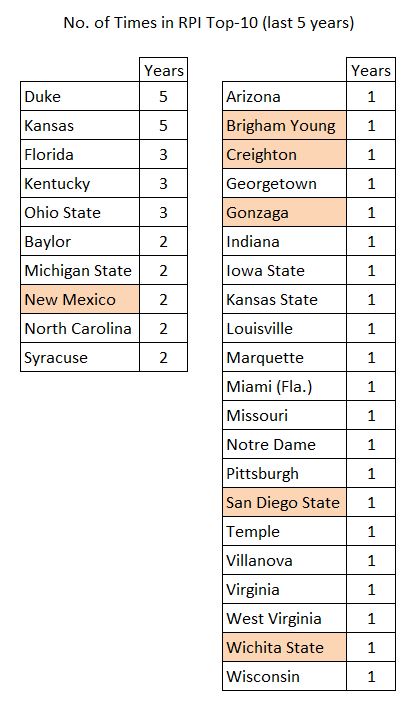
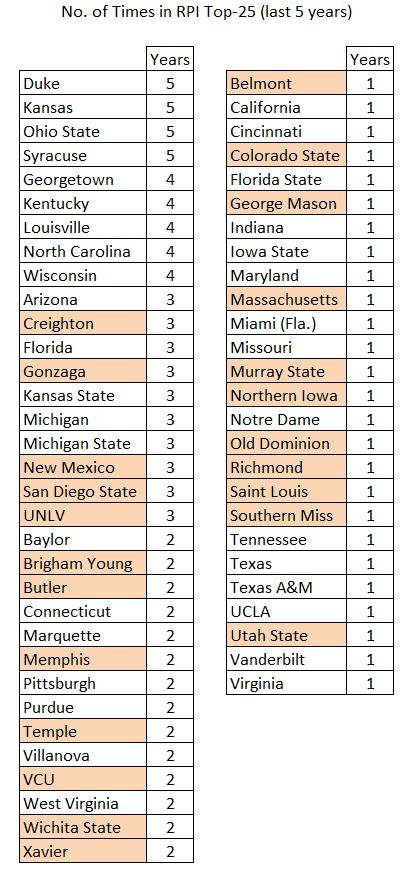
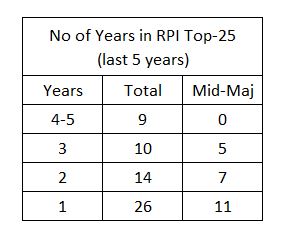
I think that by highlighting the mid-majors, it is easy to prove that mid-majors frequently show up at the top of the rankings…but are still a long way from parity.   Here’s a summary table of the Top-25 rankings over the last five years that highlight where mid-majors fall among the elite of college basketball.

Summary_RPI_Top_25
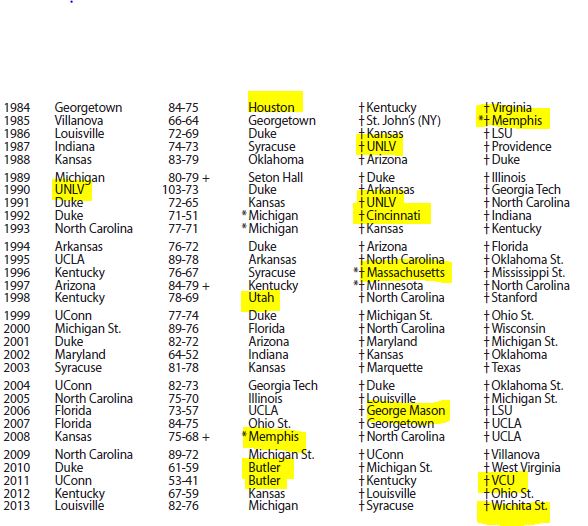
As I mentioned earlier, being in the Top-25 doesn’t necessarily mean that you are a legitimate Final Four candidate.   So let’s wrap up the tables with a snap-shot of the actual Final Four teams since 1984 and see how many mid-majors we can find:

Final Four


One of the things that Bilas harped on in the article linked in the first paragraph, was for those arguing for parity to define when it arrived.   In other words if a sweeping change has taken place, then exactly when do we find the change?

While not moving into actual parity, the recent appearances in the Final Four by Butler, VCU, and Wichita State clearly show up as a change.    Have the one-and-done players left room for mid-majors to move up?    Or are their recent appearances just normal variations and not the start of a trend?   As with most things, time will tell.


CONCLUSION

I think that it is pretty obvious that by any reasonable definition, parity does not exist in college basketball.  The make-up of the basketball elite varies from year-to-year, but doesn’t include many mid-majors.      I like my tables, but I can reach this same conclusion with a short list in Jeopardy format:   Pete Gillen, Skip Prosser, Thad Matta, and Sean Miller.

The correct question is “Who were former basketball coaches at Xavier?”   Parity in college basketball does not and will not exist because the much richer schools will hire away successful coaches from the mid-majors.   For a more recent example, WF more than quadrupled Danny Manning’s salary to get him away from Tulsa.

As I’ve said many times, success in college sports is always tied to the head coach.    The head coach is responsible for every aspect of his team/program and all successes and failures lead back to his office.   A program, high-major or mid-major, will not retain elite status without elite coaching…and lots of money.


Post Script

VCU and San Diego St have found different ways to get around the iron-law of free commerce to keep successful coaches.   VCU has chosen to pay Smart in the same neighborhood as many high-major coaches (by raising tuition at least once) in an attempt to keep him in Richmond.   San Diego St gave Steve Fisher a second-chance after the scandal at Michigan.   After five-straight trips to the NCAAT, that second-chance has certainly paid dividends AND the 69-year old Fisher has the 13th ranked recruiting class coming in this fall.

The path taken by San Diego St is really not a blue-print to success for mid-majors.    But, VCU’s approach could work for other schools.  The open questions about VCU are:

–        How long will VCU’s approach work?    (Note that it works pretty well so-far and even kept Shaka away from UCLA.)

–        Is winning important enough for other mid-major programs to step up and do what it takes to keep their basketball coach?

About VaWolf82

Engineer living in Central Va. and senior curmudgeon amongst SFN authors One wife, two kids, one dog, four vehicles on insurance, and four phones on cell plan...looking forward to empty nest status. Graduated 1982

College Basketball Stat of the Day

Home Forums Parity in College Basketball

Viewing 14 posts - 1 through 14 (of 14 total)
  • Author
    Posts
  • #50906
    VaWolf82
    Keymaster

    During one of the studio sessions this past season ESPN posed the question, “Have the mid-major schools reached parity with larger schools?” to Digger and Bilas
    [See the full post at: Parity in College Basketball]

    #50930
    Wufpacker
    Participant

    Excellent look at the landscape Va. I enjoyed this very much.

    It reinforces what I already had thought as well. Of course, my own eyeball-ish analysis was limited to the question “If there’s so much parity, then why do the talking heads gush over the likes of Wichita State, Butler, George Mason, etc. when they get their moment(s) in the sun?”

    It’ll be interesting to see how much longer Scary Wheat holds onto Marshall.

    #50931
    Wulfpack
    Participant

    I’ve been thinking about this one for a while. The big guns are still the big guns, but the midd are making a serious run. Those top programs will continue to get the top players and top coaches, but many of those top players are leaving early, leaving unbalanced rosters. The Butlers, VCUs, Gonzagas, Creightons, Daytons, Wichita States of the world are building true programs. VCU has been able to keep Smart. Few has stayed at Gonzaga. Marshall at Wichita. Think about attendance, too. Creighton and Wichita are way up there, better than most ACC schools in fact. And some of these coaches are being paid quite handsomely.

    To further illustrate the point, I took a look at the top 40 on the final Dance Card, and there are 12 mids there.

    But to Va’s point, what exactly is a mid? I’m not sure I know anymore. And schools like St. john’s, Marquette, Providence, Gtown, Cincy, etc may soon find themselves at more of a mid major status as they are currently excluded from the power conferences.

    So here’s the 12 in the top 40:

    Wichita State
    Creighton
    SDSU
    Saint Louis
    UMass
    St. Joe’s
    VCU
    George Washington
    Dayton
    Gonzaga
    Memphis
    Xavier

    If some of these are “mids”, well, they don’t have it so bad. They are getting it done.

    #50936
    VaWolf82
    Keymaster

    I thought about comparing the best mid-major programs to teams routinely found in the middle of the power conferences. But the prospects were just too depressing to seriously consider.

    #50947
    BJD95
    Keymaster

    I think VA’s onto something there. Are the mid-majors stepping into the void that the power conferences’ “middle class” denizens have stumbled down from?

    You’re right, it’s not true “parity” but it is an interesting dynamic for sure.

    #50950
    TheCOWDOG
    Moderator

    The term Mid-Major, is a media figment.

    Teams like Creighton, Dayton, The 2 New Mexicos, Wichita, Xavier and a number of others (in and out ) have basketball historys that cover over half a century of clobbering the middlin’ type Big Boys.

    #50976
    Whiteshoes67
    Participant

    Always easier to put 5 in uniform than 9 or 11. Throw in the 3-pt equalizer, early exits, transfers, roster instability, and media exposure virtually anywhere and you get the democratization of basketball. The distance between the “haves” and “have nots” may still be wide, but not as far apart as it once was, and those in the middle are far more equal. The days of dominant teams are gone.

    #50995
    Fastback68
    Participant

    So Digger argued that Mid-Majors had reached parity with larger schools. Anyway, the anal retentive accountant in me wants to reconcile the NCAAT Champion RPI for 11-25 which should be 23.8% for a column total of 100%. I would have thought that the average RPI of the champ (6.9) would be closer to the average RPI of the runner-up (11.38) if I am reading the columns correctly. Two top 10 RPI teams on average from separate brackets fighting to be #1.(The average of the average RPI of the champ/runner up is 9.14) I would be curious to see separate columns of the RPI for the F4 G1 loser and the F4 G2 loser. I would be surprised if there was any material average RPI discrepancy between the F4 losers since the only differentiation is when they played their respective games. I realize those columns are unnecessary in the quest of the final conclusion. I guess my rather limited inner mathematician would like the NCAAT to be the exact teams listed 1-68 on the season end RPI list for a solid starting point for all topics but that would take all the fun out of the madness. (Each bracket would be balanced by RPI as close as possible in mathematical terms) Again, none of the additional info I would like to see or a pure 1-68 RPI NCAAT would alter the conclusion. I just like to look at a dead horse from multiple angles. Thanks for an interesting analysis, Va.

    #50997
    VaWolf82
    Keymaster

    Anyway, the anal retentive accountant in me wants to reconcile the NCAAT Champion RPI for 11-25 which should be 23.8% for a column total of 100%.

    Thanks. Found the screw-up on my spreadsheet and will update that table sometime today.

    I would have thought that the average RPI of the champ (6.9) would be closer to the average RPI of the runner-up (11.38) if I am reading the columns correctly.

    Why? If the ranking system has any correlation to reality, shouldn’t the average champion be ranked higher than the average runner-up? (Yes, you’re reading the columns correctly.)

    I’m not sure how much significance we should put into averages, but it is something that I had never thought of looking at. It’s interesting that the average Final Four loser ranks 11.98, very close to the average champ game loser at 11.38.

    #50998
    VaWolf82
    Keymaster

    I guess my rather limited inner mathematician would like the NCAAT to be the exact teams listed 1-68 on the season end RPI list for a solid starting point for all topics but that would take all the fun out of the madness.

    I think that the fun in March Madness comes from watching the games, the upsets, and the kids. BJD and I disagree over the ideal tourney make-up…as I would like to lose the bottom 10-15 conference champions and increase the no of upsets.

    The huge differences in strength of schedules across the breadth of college basketball makes it impossible for me to put faith in any mathematical system for selecting/seeding the field. Absolutely no one (regardless of any claims to the contrary) really knew how good Wichita St was going to be when they had to play some real teams. You can repeat that statement for about a dozen other teams.

    Here’s an interesting item to ponder: all of the pundits claimed that the Mid-West was the toughest region. Does the fact that the 8-seed Kentucky (RPI of 17 should be ~ 5-seed ) won that regional support or refute the pre-tourney evaluations?

    #50999
    BJD95
    Keymaster

    What made the MW tough (really, just Wichita State’s half of the bracket) was having the toughest 4 (Louisville) and super by far the toughest 8 (Kentucky). Michigan’s half was kind of meh.

    I need to go back and dig up our initial bracket analysis thread. I remember posting amid the hue and cry over Sparty and Louisville as 4s that I thought the most underseeded teams were…Kentucky and UConn.

    #51002
    Fastback68
    Participant

    Yes, the NCAAT champ should have a higher average because they won it all was my initial thought. However, besides the anal retentive accountant in me, I also take fairness to an unrealistic level which really pisses my wife off from time to time. I assume that the NCAAT tournament works hard to balance each bracket in terms of seeds 1-16 strength to weakness. I know you will probably trounce that assumption but again that is what I would do based on my sense of fairness. I completely understand that all —- breaks loose after the tournament is set. That bracket is absurdly easy, this one is murder’s row. The brackets are, however, mutually exclusive events. If a final four team has such a high RPI number on average, then why is there a 4.48 deviation between the two teams in the final. Again, I get the average champ should have a better RPI but 4.48 just seems high. One can get lost in the data maze and the NCAAT is far from precise. Would the math indicate that on average 3/4 of the brackets produce a winner with an average RPI of 11-12? It should. I think you are indicating that the FF losers (G1&G2) average 11.98 and the runner up 11.38. That narrow range makes more sense to me. Oh well, thanks again for the discussion and for the tables.

    #51004
    VaWolf82
    Keymaster

    I assume that the NCAAT tournament works hard to balance each bracket in terms of seeds 1-16 strength to weakness.

    The Selection Committee does this to a certain extent based on THEIR overall seedings. But they also play games with getting teams to play close to home and there are also rules about when teams from same conference can play each other.

    Not a perfect system by any means, but it’s not horrible either.

    #51007
    VaWolf82
    Keymaster

    I should have expanded the section on raising tuition to cover coaching salaries. According to Wikipedia, VCU has an undergrad student population of 24,000 students and total student population of 30,000. An across the board tuition increase of $100/student would net $3M.

    That option doesn’t work for small schools like Tulsa with a total enrollment of about 5,000. (Never realized that they were a private school.) But there are a lot of LARGE schools that are considered mid-majors

    http://nces.ed.gov/programs/digest/d10/tables/dt10_246.asp

Viewing 14 posts - 1 through 14 (of 14 total)
  • You must be logged in to reply to this topic.