
Usually at the end of basketball season, I like to document the variations in strength of schedule among the ACC teams in two parts: Out of Conference and the variation in conference schedules caused by having a ginarmous league. With the dropping interest in discussing anything related to the 2015/2016 basketball season, I thought that I would combine both into one entry.
OVERALL STRENGTH OF SCHEDULE
With Selection Sunday quickly arriving, the term “strength of schedule” will be thrown around frequently with little/no context provided for the numbers. For instance, I’ve already seen Dick Vitale proclaim that a SOS rating of 150+ is “really good”. While it should be immediately obvious that he is a complete idiot when it comes to pumping up mid-majors, here are the numbers for the ACC teams to use for comparison purposes:
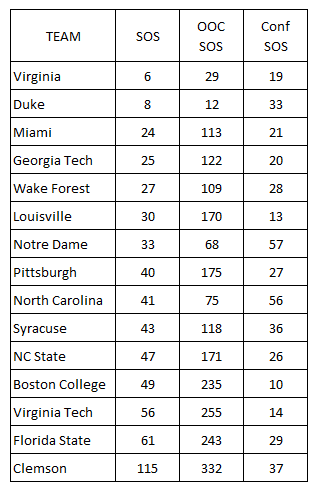
These numbers came from ESPN on Monday morning. Thus variations in Conference SOS are due solely to the regular season schedule. This column will continually change based on the match-ups in the ACCT. While those games obviously need to be included for Selection Sunday purposes, I want to look at the variations in conference schedule caused solely by having so few conference games spread among so many conference members.
The OOC SOS will also continue to change, but should be close enough for our purposes today. In general, you see that even the easiest conference SOS will improve the OOC SOS…even for Clemson.
As I looked over this table, I saw something that I have never paid attention to before. Some teams’ overall SOS ranking is better than either the OOC or Conference SOS ranking. Let’s rearrange the above table:
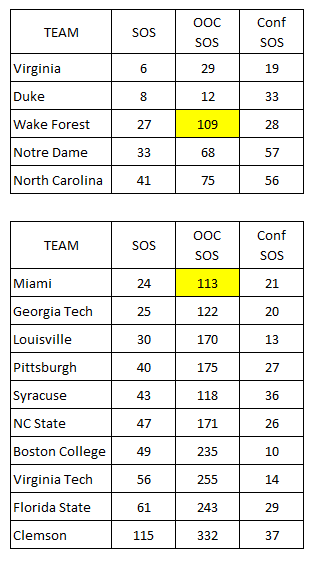
Note the two highlighted OOC SOS rankings. It seems that if you have a good enough OOC SOS, then the ACC schedule could really catapult your overall SOS to among the tops in the country. My guess is that the number of teams in good conferences that also schedule a good OOC schedule is low enough that you get the effect illustrated by the first table. Which seems like a good segue into discussing OOC SOS.
OOC SOS
Before the ACCT, every ACC team had played 30 or 31 games. Thus the OOC schedule is about 40% of the regular season. Does it make sense to anyone to throw away 40% of the regular season by having a poor OOC schedule? It’s not a hard concept to grasp, but one that eludes a substantial number of coaches.
In days gone by, this is where I would bemoan the fact that we had one of those coaches that fail to grasp the obvious. But luckily that is one problem that we don’t have anymore. I went ahead and used the numbers we have now. The rankings may change a little, but the changes over the last few days of the season shouldn’t really affect any conclusions that we would make. Here’s the conference summary starting with Gott’s first year.
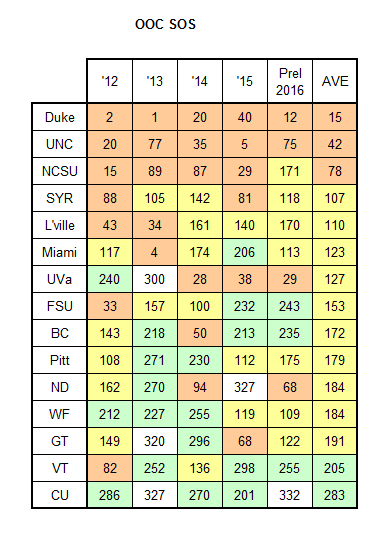
As I mentioned on Jan 1, this year will end up as Gottfried’s weakest OOC schedule by far. But I’m not overly concerned because Gott has shown that he understands how important the OOC schedule is. It looks like he should explain the concept to Buzz and Brownell.
CONFERENCE SOS
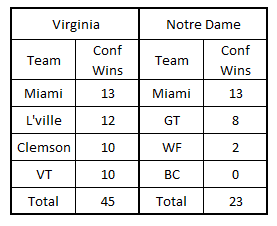
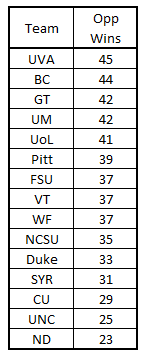
The past several years, I’ve calculated a conference SOS based on which opponents each team plays home and away. In a conference schedule with 14 opponents, each team only plays four teams home/away with two of those as defined rivals. By simply totaling the wins those four opponents have, we have a simple way of determining who had the weakest/strongest schedule. Here’s an example of the way it works:
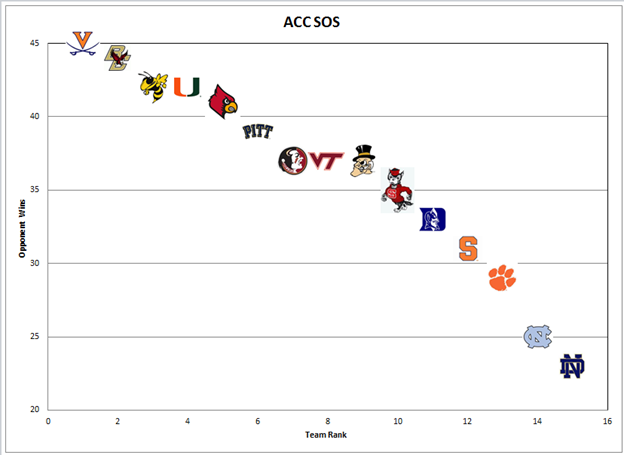
Here’s the entire conference in tabular and graphic format:
On Jan 1, I thought that State would have a harder than average conference schedule. I was wrong.
One reason to look at conference SOS is to identify those teams that profited most from an easy schedule or might have been pushed harder than they could accept. But no matter how hard BC’s schedule was, there really is no reason to compare their schedule with anyone else. So I broke the conference into two pieces…those contending for a NCAAT bid and those that are not. Here’s that split along with the master ACC schedule:
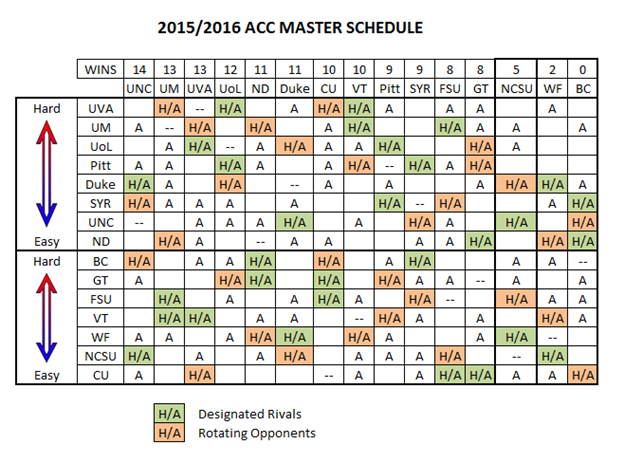
Note: To figure out where a game was played, read along the rows. For instance, Miami played UNC in Chapel Hill.
Clemson had about the perfect schedule for a bubble team. They only played nine games against the top eight teams, with six of those nine games played at home. But their problem was they simply couldn’t perform on the road against teams that they should have beaten easily….or would have beaten easily if they were really good enough to make the NCAAT.
Comparing a schedule like Pitt’s (everyone towards middle) with Duke’s (skewed towards top/bottom) can be difficult. But it is what it is and the results seem to make sense when you look at the table qualitatively as well as mathematically. I’m not saying that this system is perfect, but it doesn’t suck either.
I’ve always thought that the designated rivals would tend to skew the schedule difficulty. For instance, ND has GT and BC versus Louisville who has UVA and Pitt. I’ve always wanted to do a multi-year comparison and now with three year’s data we finally can.
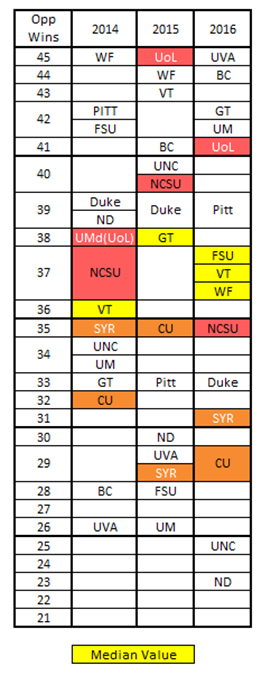
I’m sure if you pointed out the variations in schedule difficulty to anyone at the ACC office, they would claim that the schedule difficulty would even out over time. But when half of your home/away games are pre-set, the variation will come when one program falls apart or turns around. For instance, VT’s big turnaround certainly helped move UVA and Miami from the bottom third the first two years, into the top third this year.
L’ville has UVA and Pitt as their two defined rivals. While Jamie Dixon and Pitt haven’t exactly set the ACC on fire, they are far from being bottom feeders and Bennett has UVA rolling. Does anyone really think that either program will have multiple bad years in close proximity?
On the other end of the spectrum you have ND with GT and BC as their defined rivals. While ND has the easiest schedule this year and in the bottom third last year, their schedule was in the top third two years ago. So while the defined rivals have a big effect, every team also has two rotating opponents that can either add to or counteract the effect of the two defined rivals.
There is no more mis-used statistical function than “average”. This may well be another example of that mis-use, but I decided to do it anyway. If you rank the teams each year from 1-15 and then do a three-year average, this is what you get:
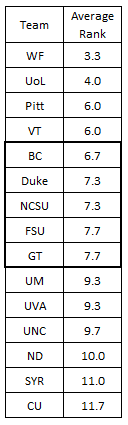
If the schedule difficulty really even outs over time, then the averages should converge on 7.5. But we certainly aren’t converging after three years. I haven’t decided how long I will report the average finish. I might be missing something, but the results are interesting to me.
WHAT ABOUT CONFERENCE SOS IN THE FIRST TABLE?
The Conference SOS reported by ESPN uses the entire season’s results while I’m just using the conference results. Here’s a mash-up showing how the two systems compare:
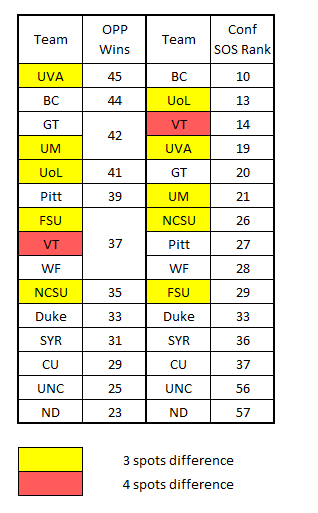
I looked at VT’s opponents, to see why they had the largest difference between the two systems. Going back to the Jan 1 entry, a number of teams have a similar ranking within the conference based on Jan 1 RPI as the final regular season conference standings….and some do not. Two of VT’s home/away opponents fit into the “not similar” category. Both Pitt and WF ranked much higher in the conference at the conclusion of the OOC games than they did in the final conference standings. So I’m assuming that the tail-off by Pitt and utter collapse by WF explains why the official calculations think more of VT’s schedule than I do.
I like the concept of ranking conference SOS solely on results within the conference. But there is certainly an argument to be made for “not throwing data away” (I should know because I’ve used it many times in the past.) But when I look at VT’s conference schedule, I just don’t think that it is the third toughest. Anyone disagree?
Earlier in the year, we had a discussion in the comments about the fact that the ACC RPI as a conference was ranked third or fourth and what effect that would have on getting teams into the NCAAT. So I thought that I would add a postscript to that discussion and see how the ACC’s range of conference SOS’s ranked with the other power conferences. Here is a graph to illustrate that comparison:
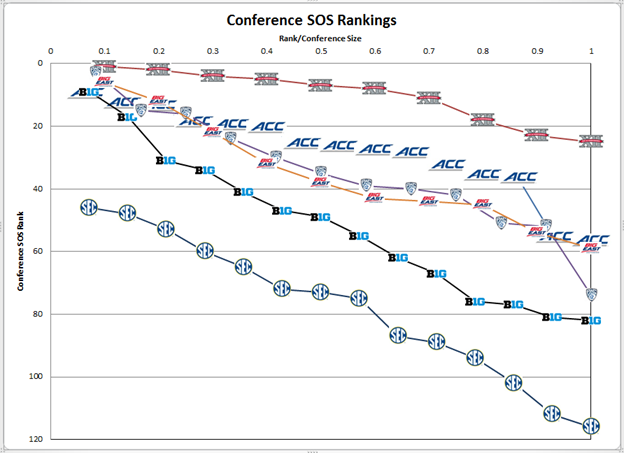
So the ACC schedules would in general provide a better RPI boost than most of the other conferences. In other words, if an ACC team doesn’t make the NCAAT, it isn’t because they are playing in a weak league.
Since the ACC is the largest power conference, I expected that the delta between the toughest conference schedule and the easiest one to be larger in the ACC than the other large conferences. Surpassingly, that didn’t turn out to be true. The Big 12 was the only conference with a smaller gap between top and bottom than the ACC. That discovery once again proves that logic is frequently an insufficient substitute for facts.
CONCLUSIONS
This isn’t really the type of blog entry aimed at producing new conclusions. It’s aimed at people like me that like to tear things apart to see how they work. It won’t appeal to everyone (especially this year), but I’m not the only geek around here.
In the days of yore, the ACC schedule was always tough enough that you never really needed to worry about the OOC schedule. But those days are gone forever. Since you have no control over 60% of your schedule, you need to make smart decisions with the 40% that you do have control of.
Oh and you need to win at least 2/3 of the games too. Hopefully someone in Raleigh is working towards that goal.
